How to Debug APIs Efficiently: Best Practices and Tools
Debugging APIs is a vital aspect of API development, ensuring optimal performance and functionality. Numerous tools and techniques are available to help identify and resolve issues effectively.
Debugging APIs is a crucial step in API development to ensure they function correctly and efficiently. Various tools and techniques are available to help diagnose and resolve issues. This guide covers practical tips and tools, with a focus on how to use them effectively.
1. Using Postman for API Debugging 🛠️
Postman is a powerful tool that helps you test API endpoints with ease. Here's how to make the most of it:
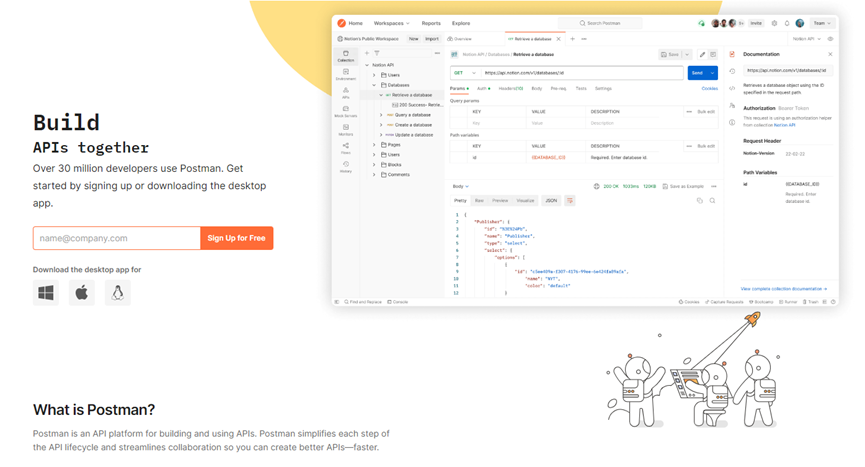
Sending Requests
- Basic Operations: You can perform GET, POST, PUT, DELETE, and other HTTP methods from the dropdown and enter the URL.
- Headers and Body: Add necessary headers and body data in the respective tabs.
Scripts and Automation
- Pre-request Scripts: Written in JavaScript, these scripts run before a request is sent.
pm.environment.set("token", "your_api_token");
- Tests: Postman allows you to write tests to validate responses. After executing a request, you can write tests under the "Tests" tab to automate response verification.
pm.test("Status code is 200", function () {
  pm.response.to.have.status(200);
});

pm.test("Response time is less than 200ms", function () {
  pm.expect(pm.response.responseTime).to.be.below(200);
});
Collections and Workspaces
- Collections: Group related requests and save them for future use. This is particularly useful for organizing testing suites.
- Workspaces: Collaborate with your team by sharing collections and environments within Postman workspaces.
2. Using EchoAPI for API Debugging 🔥
EchoAPI is a cutting-edge API testing tool that revolutionizes the way developers and testers approach API testing. EchoAPI stands out for its innovative features and user-centric design, offering an intuitive platform for comprehensive API testing.
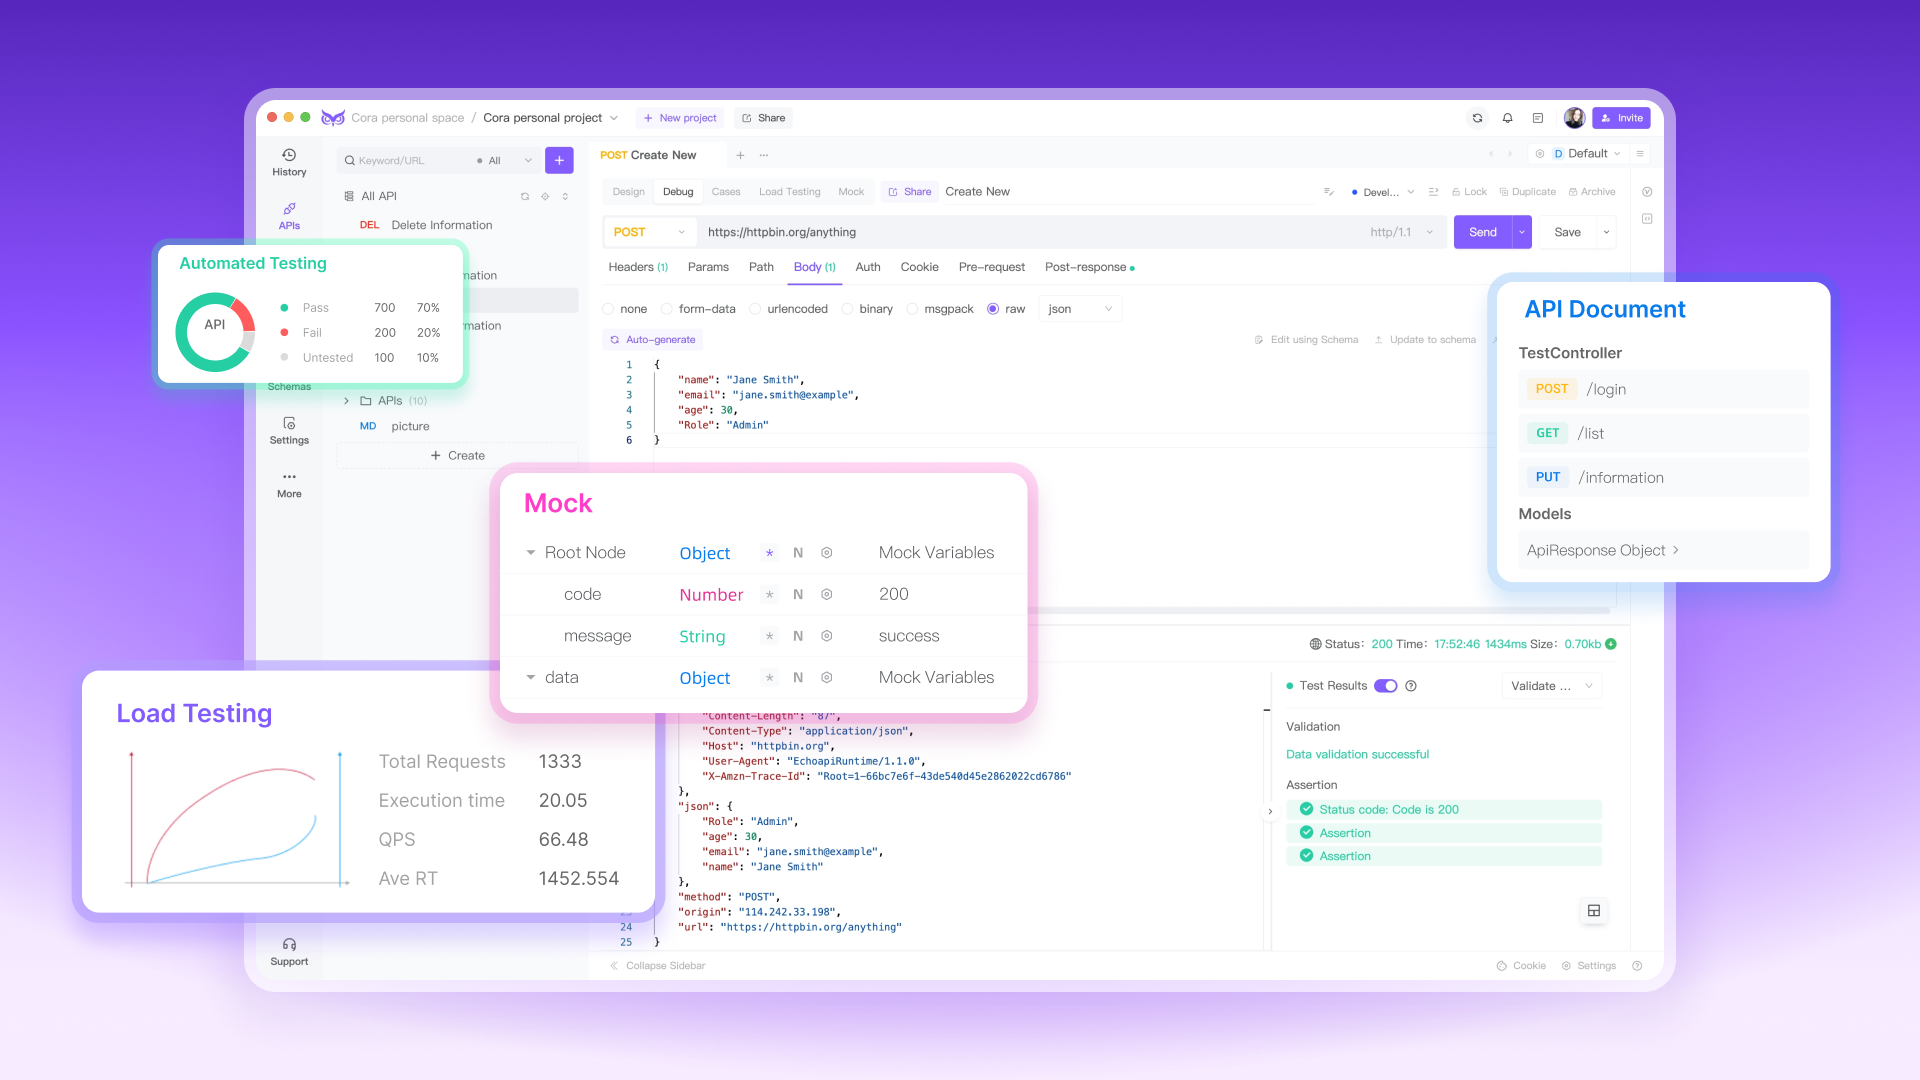
Complete Compatibility
- Postman Script Support: EchoAPI fully supports Postman scripts and syntax, allowing you to import and use your existing Postman collections without any modifications.
- Seamless Integration: Easily integrate with other tools and services, maintaining high compatibility.
Superior Features
- **Comprehensive Request Handling: ** Perform all standard operations (GET, POST, PUT, DELETE) with a user-friendly interface.
- **Centralized Request Parameters: ** EchoAPI's global parameters feature simplifies API testing by providing centralized management. This eliminates manual updates, boosts efficiency, and enhances flexibility, making testing scalable and easy to maintain.
Enhanced Automation
- Pre-request Scripts and Tests: Like Postman, EchoAPI enables pre-request scripts and tests, empowering you to automate and validate your API workflows.
pm.environment.set("token", "your_api_token");

pm.test("Status code is 200", function () {
  pm.response.to.have.status(200);
});

pm.test("Response time is less than 200ms", function () {
  pm.expect(echo.response.responseTime).to.be.below(200);
});
Collaboration and Documentation
- Workspaces and Collections: Create and share collections and workspaces for enhanced teamwork and streamlined collaboration.
- Built-in Documentation: Automatically generate and maintain up-to-date API documentation based on your requests and collections.
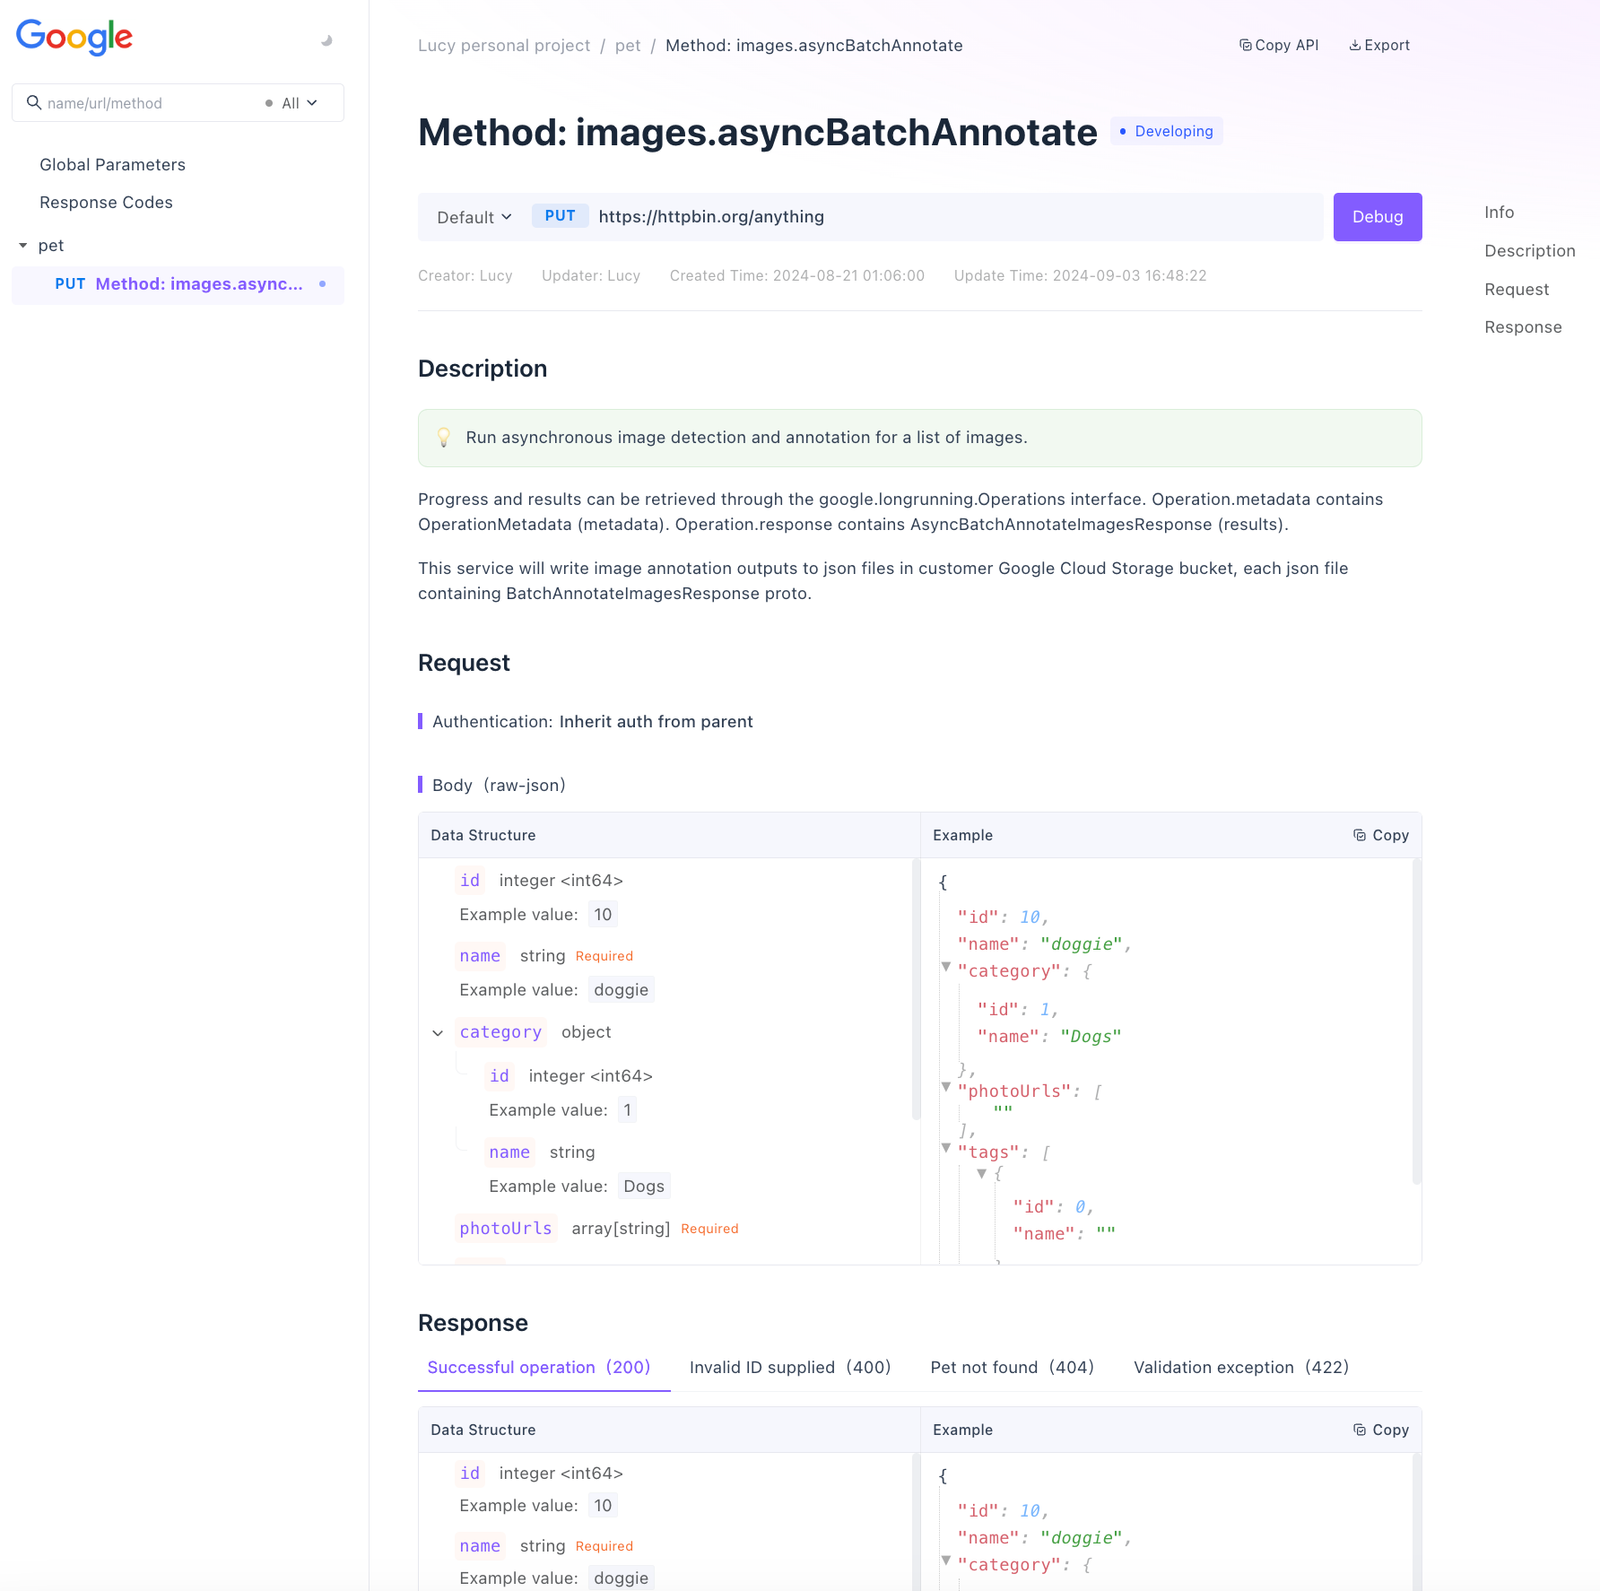
Integration and Automation Testing
- CI/CD Integration: Seamlessly integrate with CI/CD pipelines to automate testing and deployment workflows.
- Comprehensive Tool Integration: Ensure flawless compatibility with various tools and platforms for robust testing.
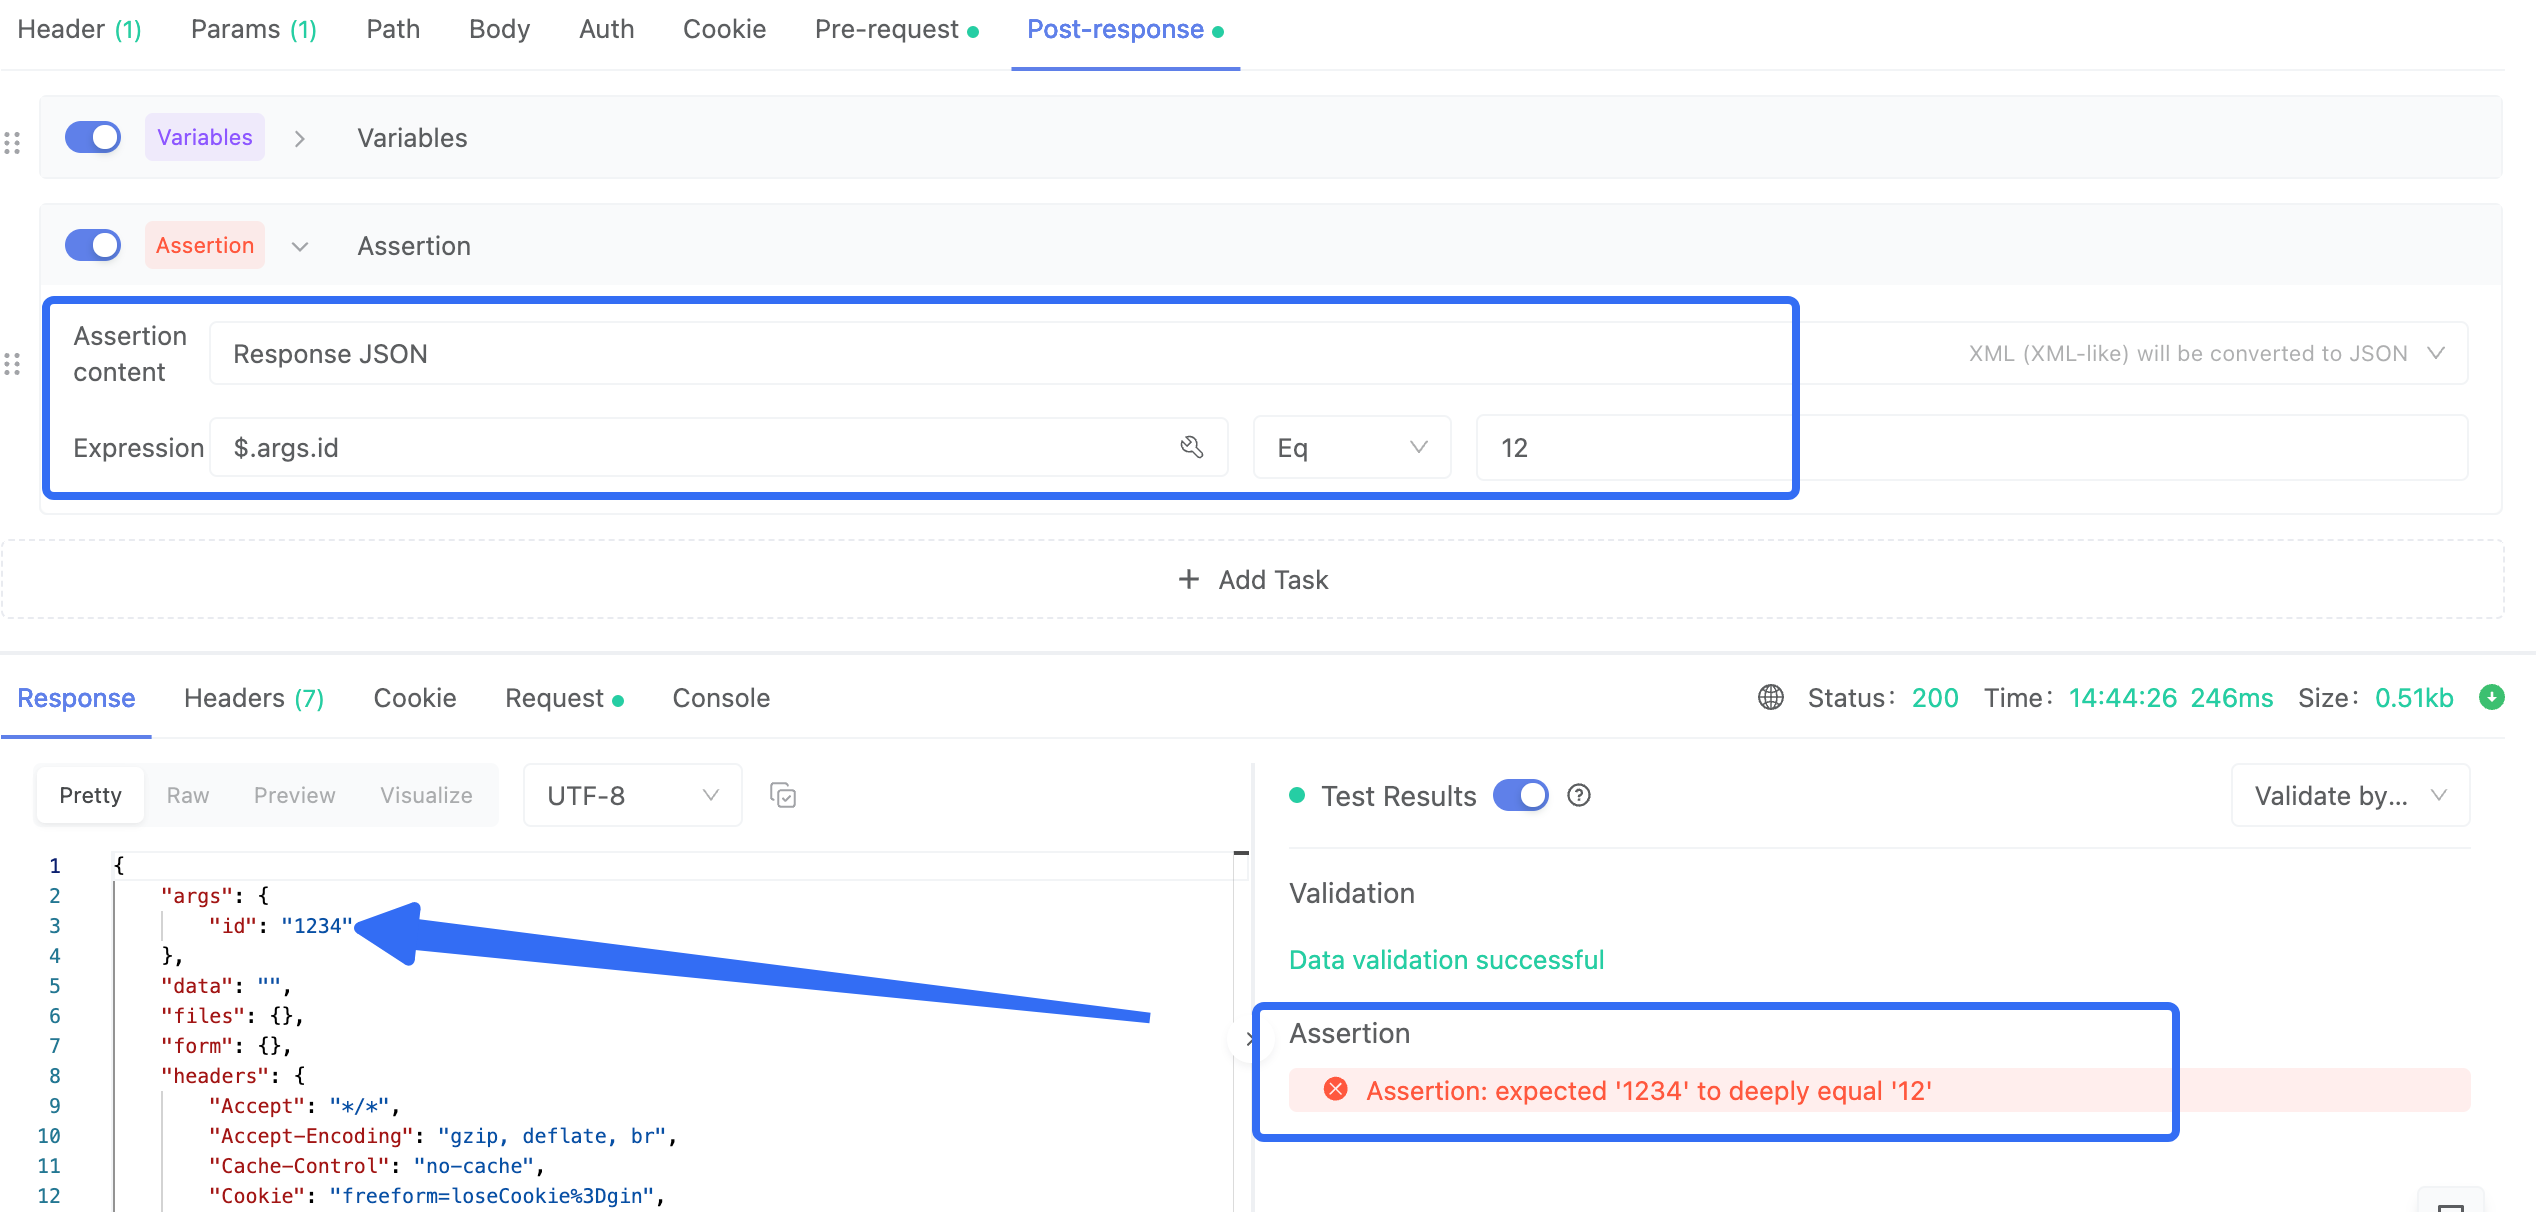
Visualizing Assertion and Variables Settings
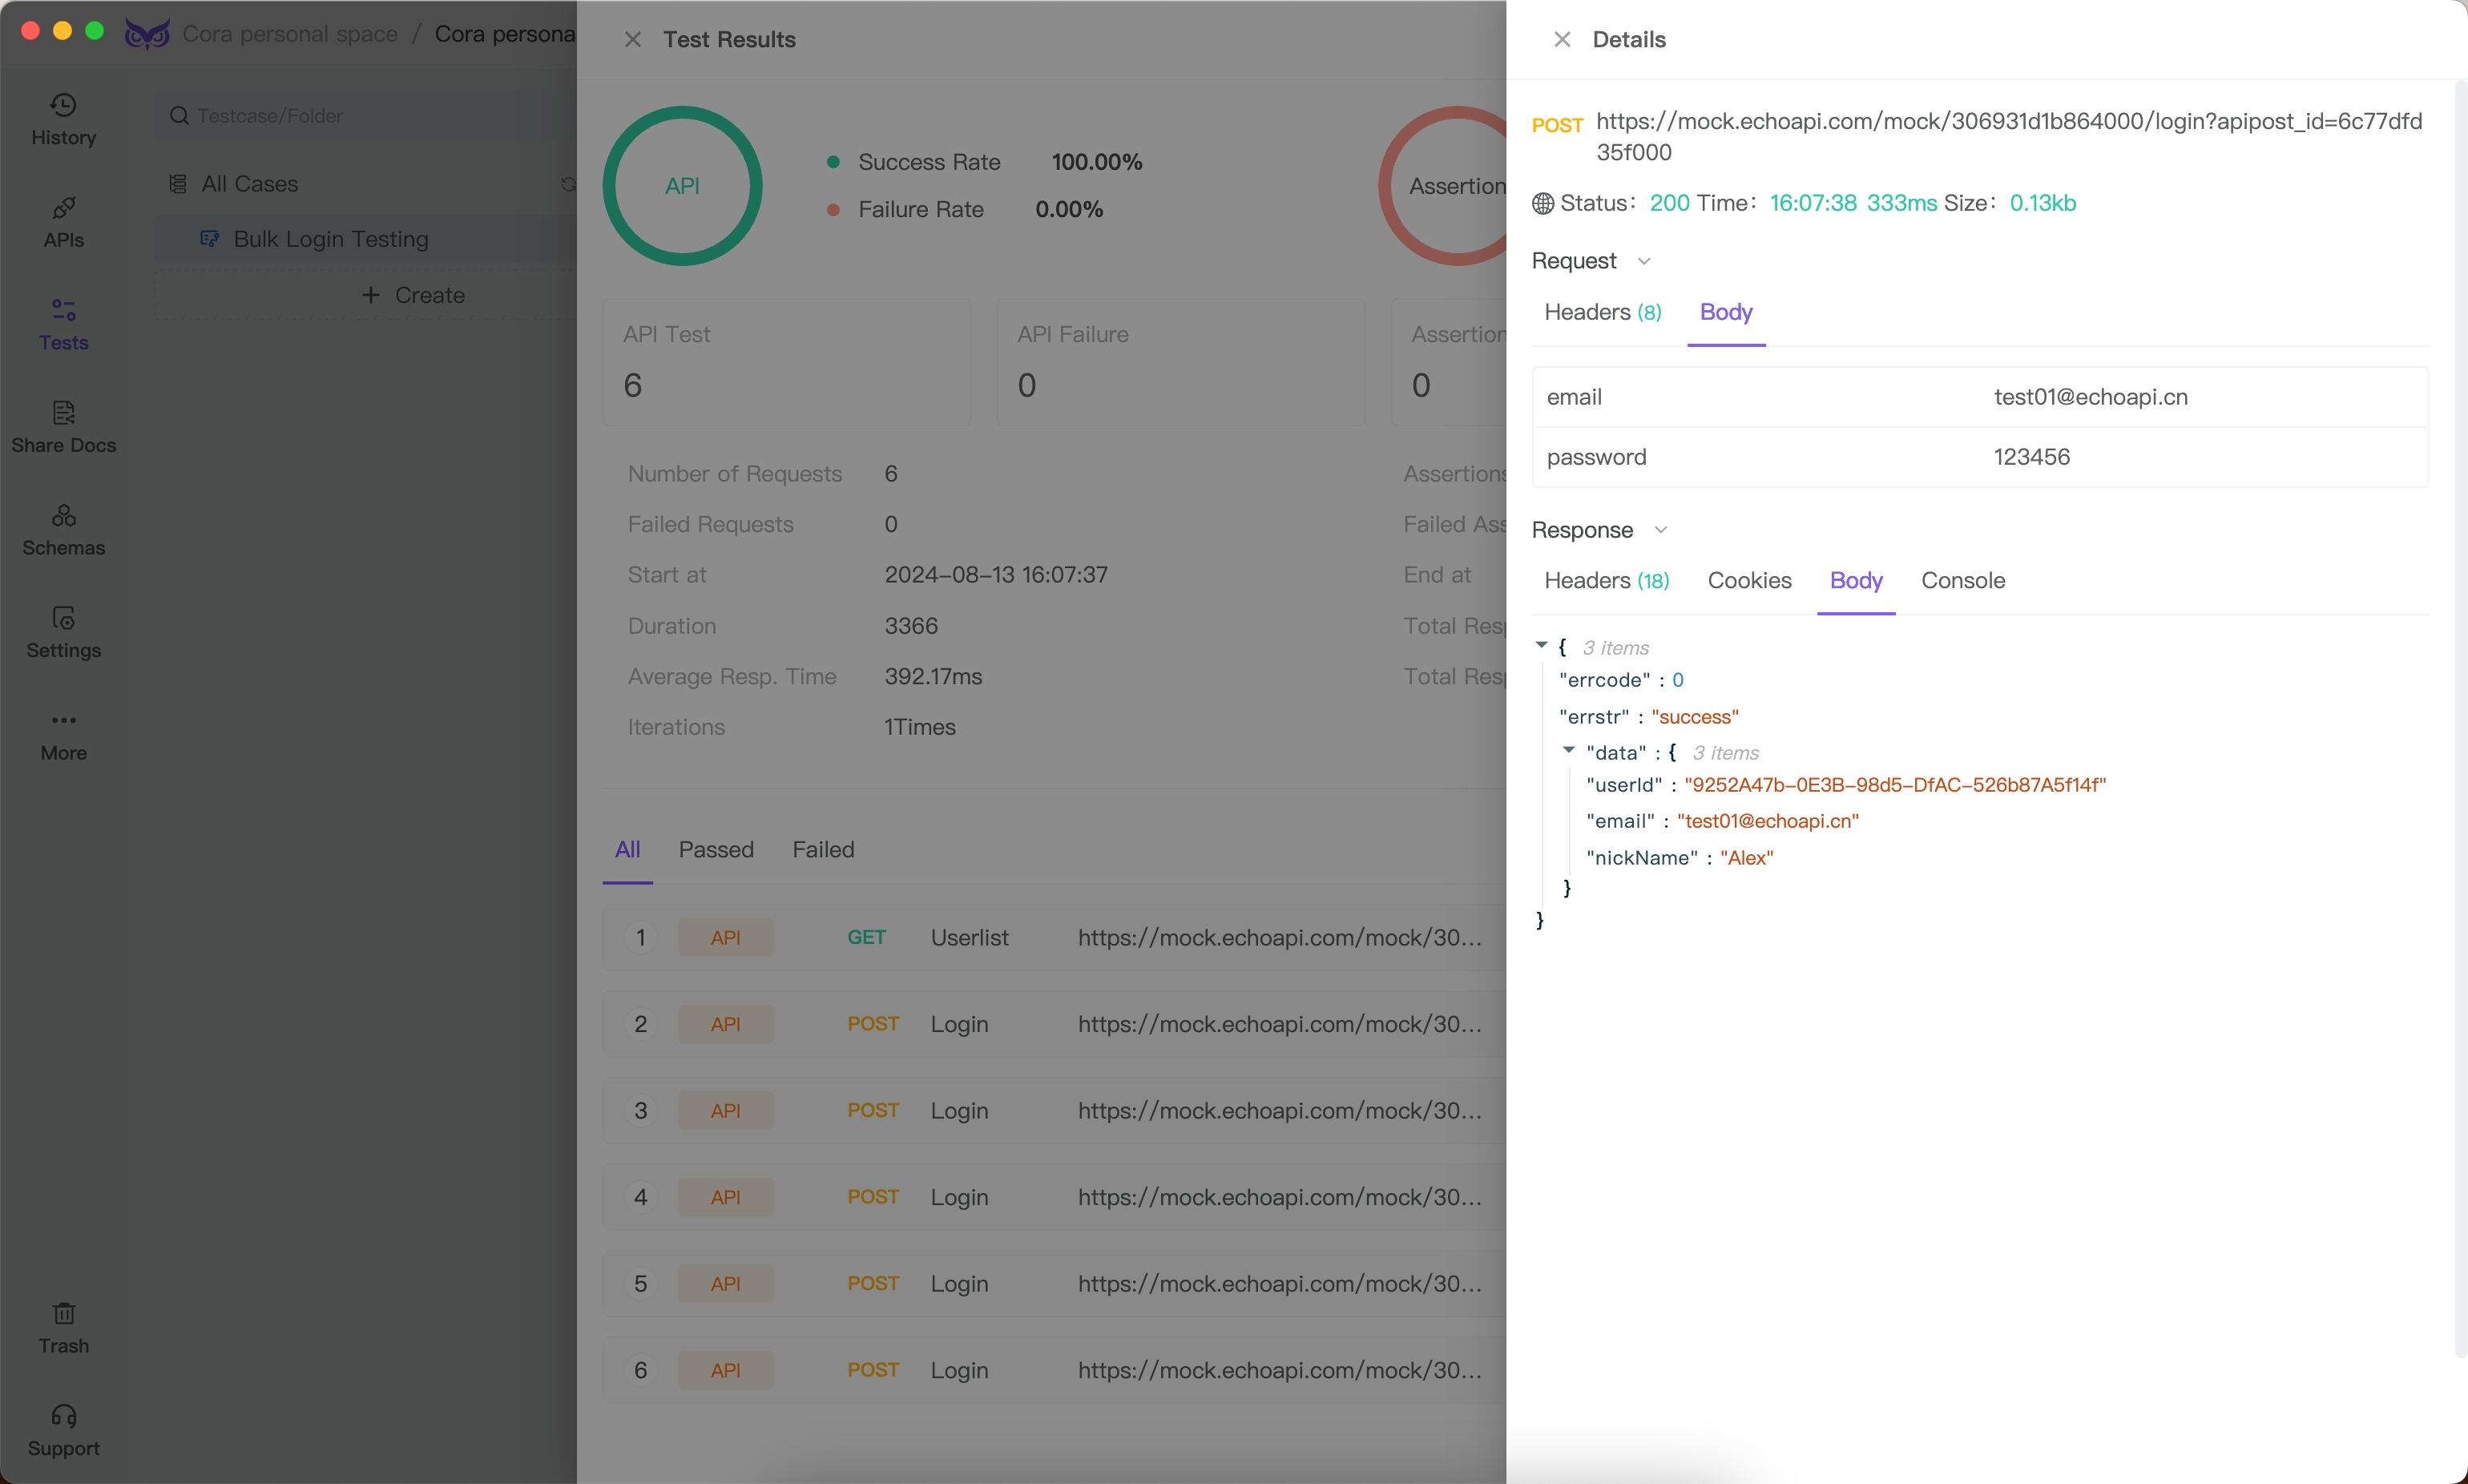
- Direct Assertion Verification: Instantly verify Response JSON, Response XML, Response Text, Response Header, Response Cookie, Response Code, Response Time, Temporary Variables, Environment Variables, and Global Variables.
- Simplified Testing: Set up tests, extract data, and validate responses effortlessly without complex scripting.
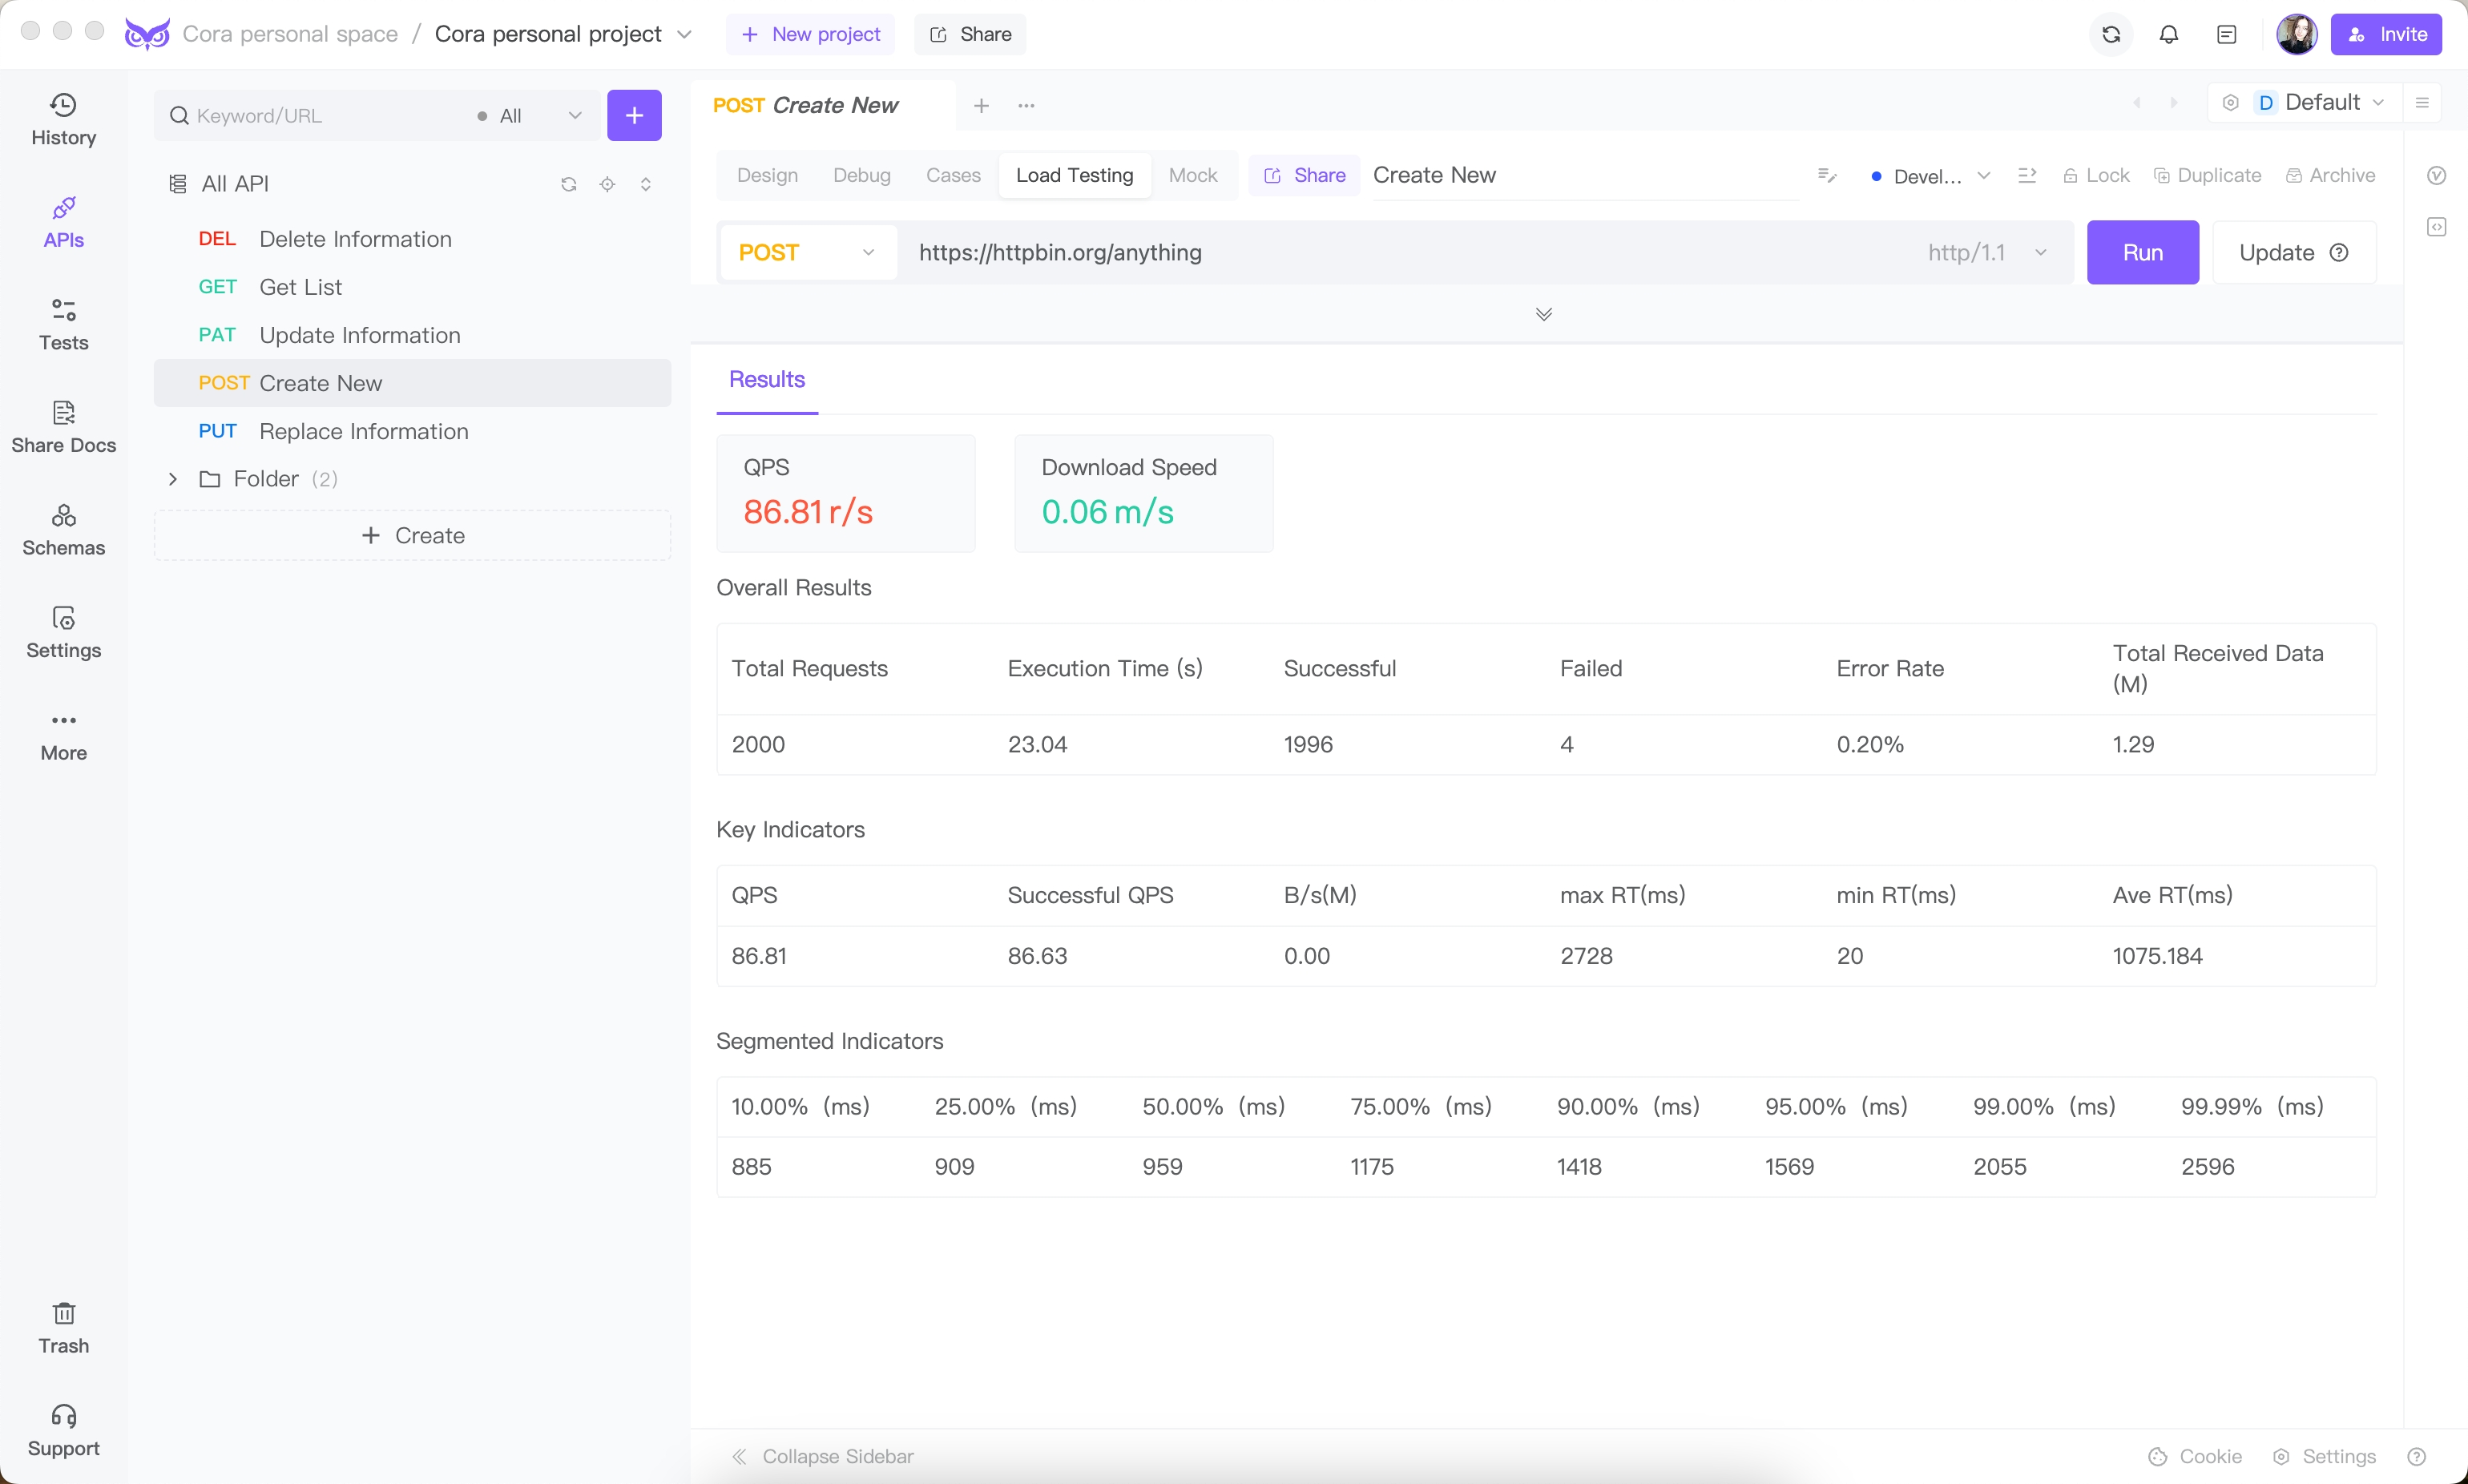
Load testing
- Performance Analysis: Optimize code, configurations, and resources by analyzing performance metrics such as response times and throughput.
- Risk Mitigation: Mitigate risks related to system failures, downtimes, and performance degradation, thereby protecting the software’s reputation and integrity.
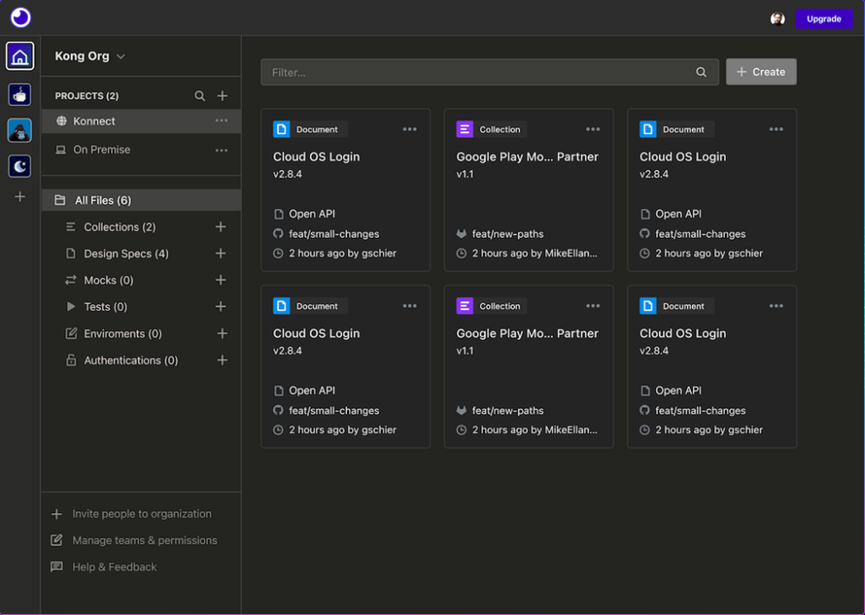
3. Using Insomnia for API Debugging 🌌
Insomnia is another excellent tool for testing APIs, with a focus on a more streamlined and minimalist interface.
Environment Variables
- Managing Environments: Define environment variables for different stages (development, testing, production).
{
  "base_url": "https://api.yourapp.com",
  "api_key": "your_api_key"
}
Chaining Requests
Insomnia allows you to chain requests by using environment variables to pass data between them.
- Example:
- First Request: Fetch a token and save it in an environment variable.
{ "token": "{{response.body.token}}" }- Second Request: Use the saved token for authentication.
GET /user/profile
Authorization: Bearer {{token}}
Response Validation
- Response Filtering: Simplify debugging by filtering and formatting JSON responses for better readability.
4. Debugging with Integrated Development Environment (IDE) 🖥️
Using VS Code
Visual Studio Code (VS Code) offers extensive features for debugging APIs.
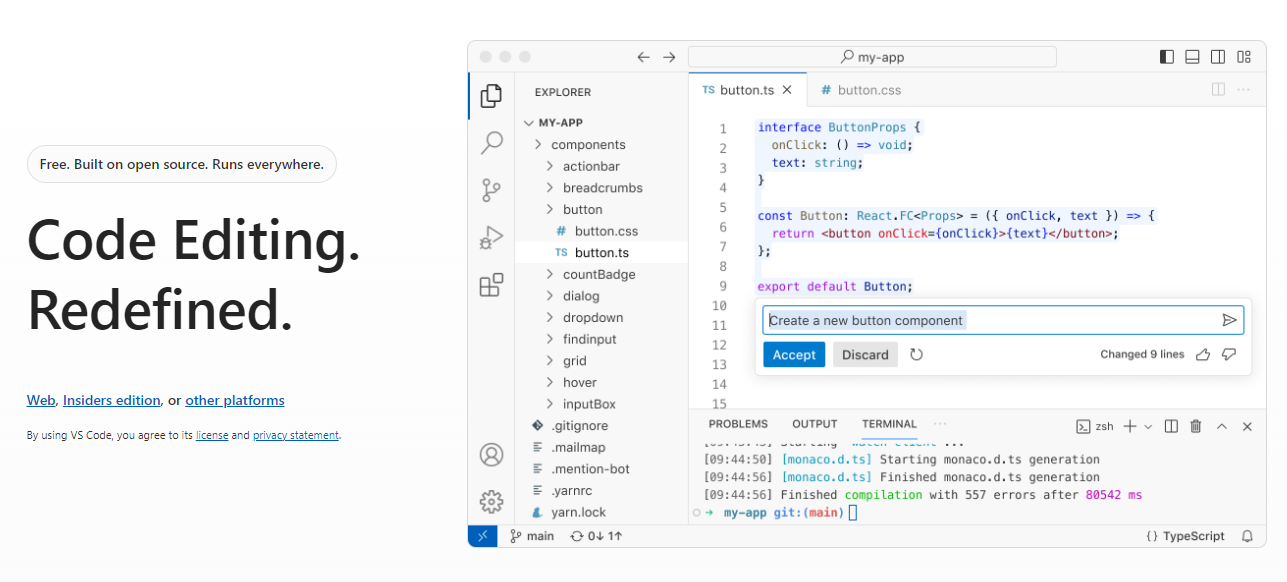
REST Client Extension
- Direct API Calls: Use the REST Client extension to write and execute API calls directly within VS Code.
GET https://api.yourapp.com/users
Authorization: Bearer your_token
Breakpoints and Watches
- Setting Breakpoints: Set breakpoints in your code to pause execution and investigate variable values.
- Watches: Add variables to the watch list to monitor their values during runtime.
5. Logging and Monitoring 📈
Implementing Structured Logging
Use structured logging to capture detailed information about API requests and responses.
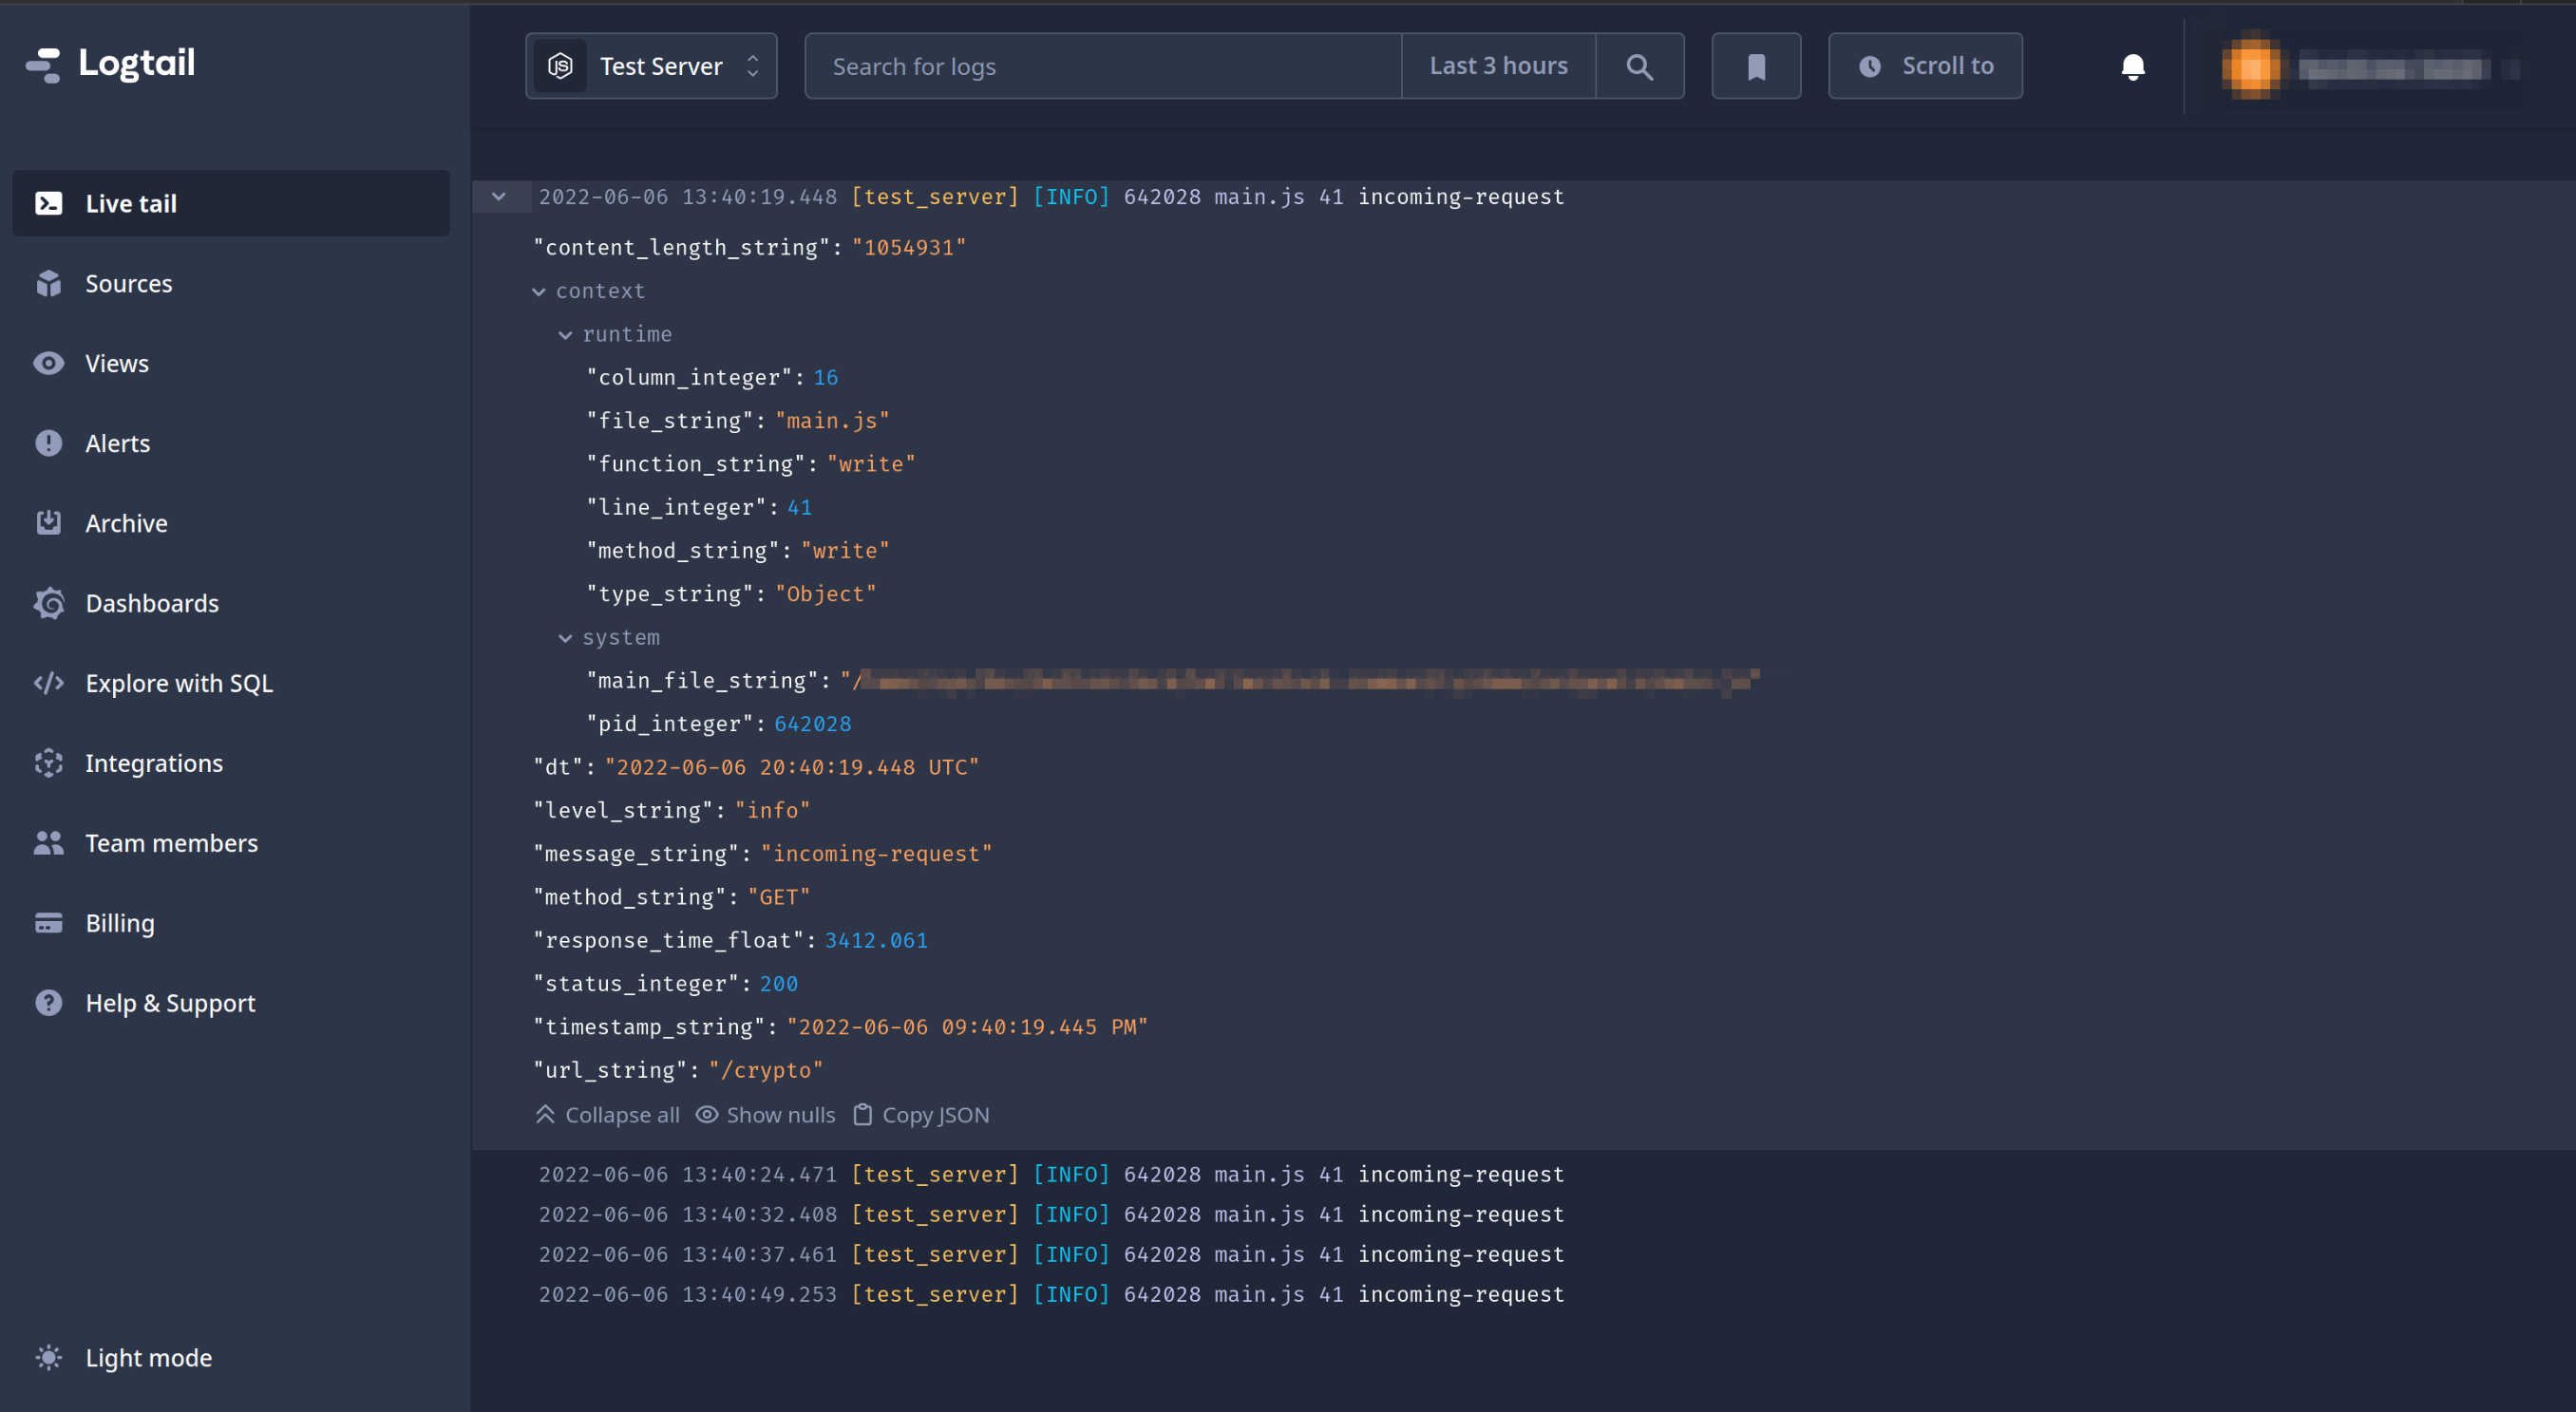
- Example with Node.js and Winston:
const winston = require('winston');
const logger = winston.createLogger({
  level: 'info',
  format: winston.format.json(),
  transports: [
    new winston.transports.File({ filename: 'combined.log' }),
  ],
});

app.use((req, res, next) => {
  logger.info({ method: req.method, url: req.url, body: req.body });
  next();
});
Monitoring Performance
Tools like New Relic, Datadog, or Prometheus can help monitor API performance, detect bottlenecks, and track error rates.
Rate Limiting and Caching
Implement rate limiting and caching strategies to protect your API and improve performance.
- Rate Limiting Example with Express-rate-limit:
const rateLimit = require('express-rate-limit');
const limiter = rateLimit({
  windowMs: 10 * 60 * 1000, // 10 minutes
  max: 100, // Limit each IP to 100 requests per windowMs
});

app.use(limiter);
Conclusion 🌟
Debugging APIs involves a mix of powerful tools and best practices. By leveraging tools like Postman, EchoAPI, Insomnia, and integrated IDE features, you can effectively identify and resolve issues in your APIs. EchoAPI stands out with its comprehensive features and Postman compatibility, making it an excellent choice for developers looking for robust capabilities. Proper logging, monitoring, and performance optimization are also crucial for maintaining robust and efficient APIs. Happy Debugging! 🎉


 EchoAPI for VS Code

 EchoAPI for IntelliJ IDEA

 EchoAPl-Interceptor

 EchoAPl CLI
 EchoAPI Client
 API Design
 API Debug
 API Documentation
 Mock Server


