Optimizing API Performance with EchoAPI: A Comprehensive Guide
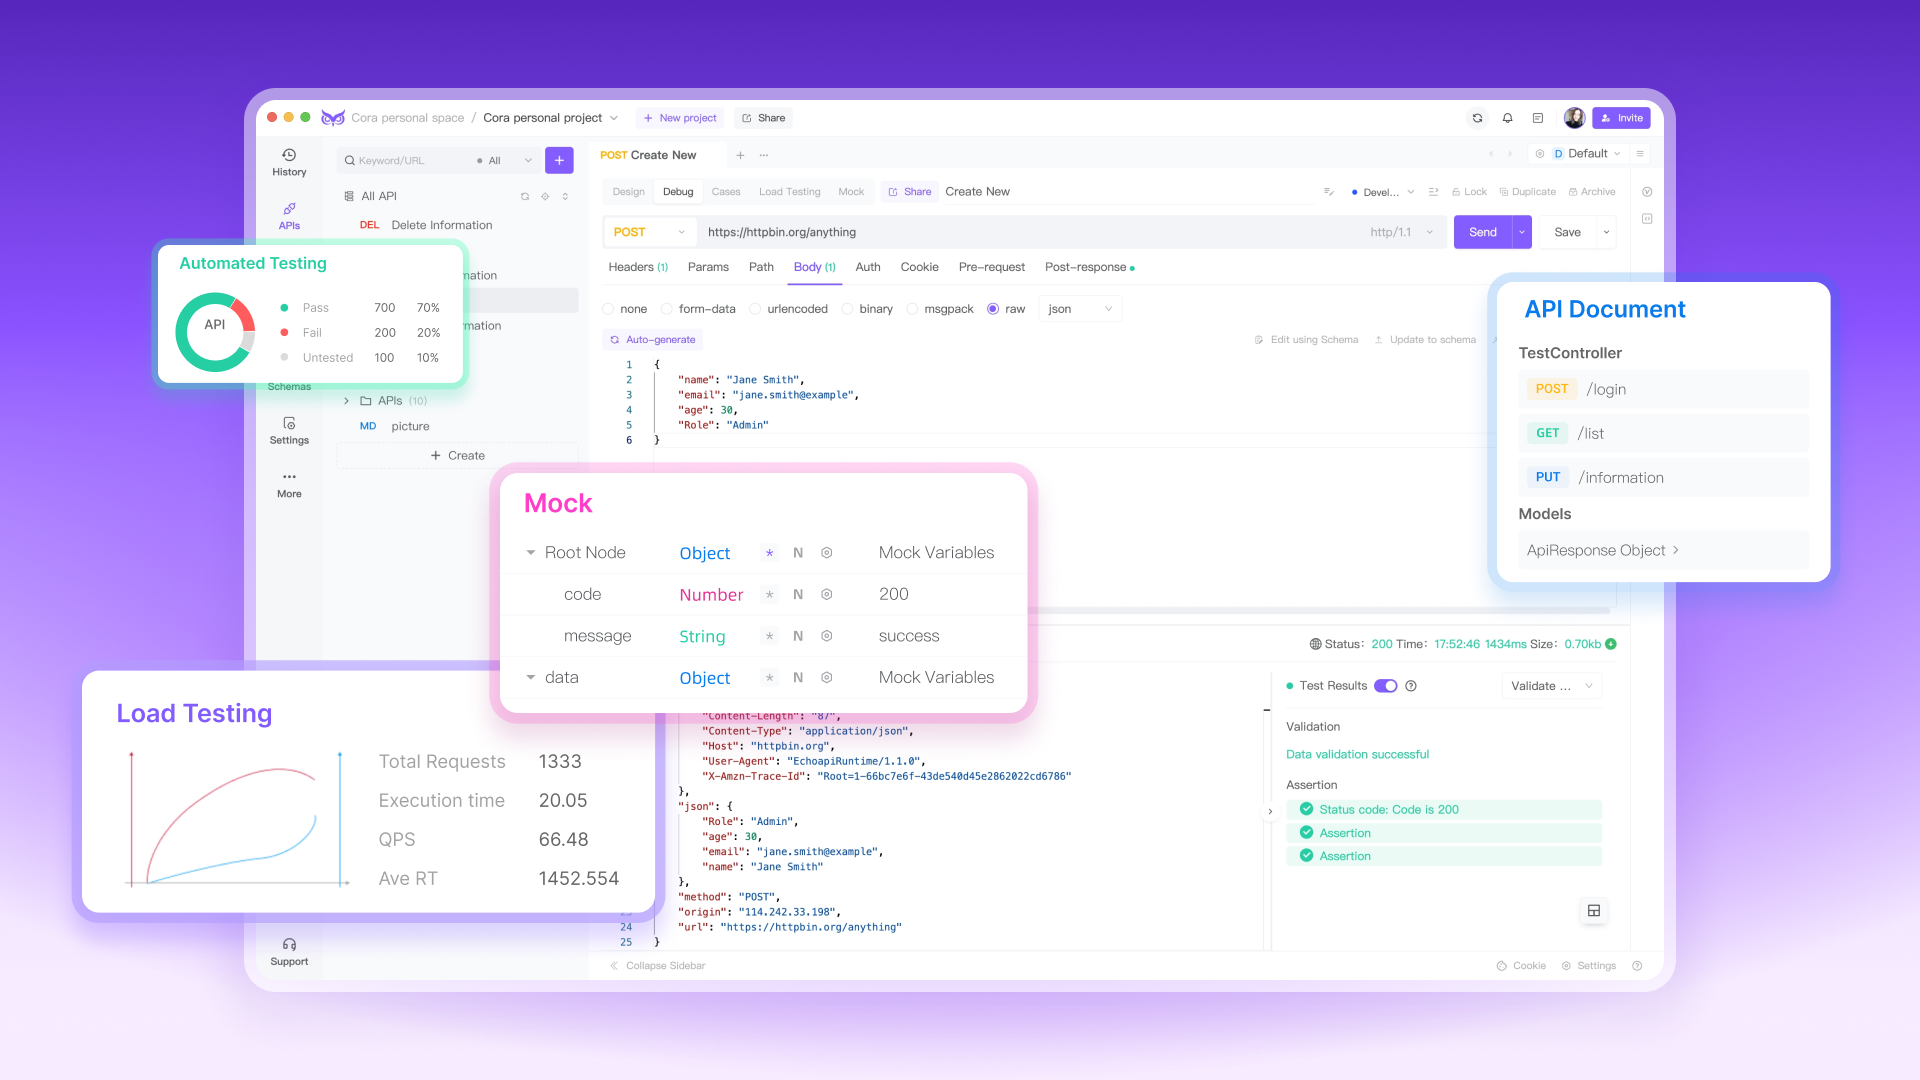
In the realm of software development, APIs are the vital conduits facilitating interactions between diverse software components. To ensure the reliability and efficiency of APIs, rigorous testing is imperative. EchoAPI emerges as a potent ally in this quest, offering seamless load testing capabilities and a treasure trove of performance metrics, including total request counts, response times, QPS (Queries Per Second), average response times, and more. Let's delve into the practical application of EchoAPI through a specific API example.
Phase 1: Preparatory Measures
Begin by pinpointing the API interface you wish to scrutinize – let's say a user login API.
curl --request POST \
  --url https://httpbin.org/anything/login \
  --header 'Accept: */*' \
  --header 'Accept-Encoding: gzip, deflate, br' \
  --header 'Connection: keep-alive' \
  --header 'User-Agent: EchoapiRuntime/1.1.0' \
  --header 'accept: application/json' \
  --header 'content-type: multipart/form-data' \
  --form email=echoapi@gmail.com \
  --form password=123456
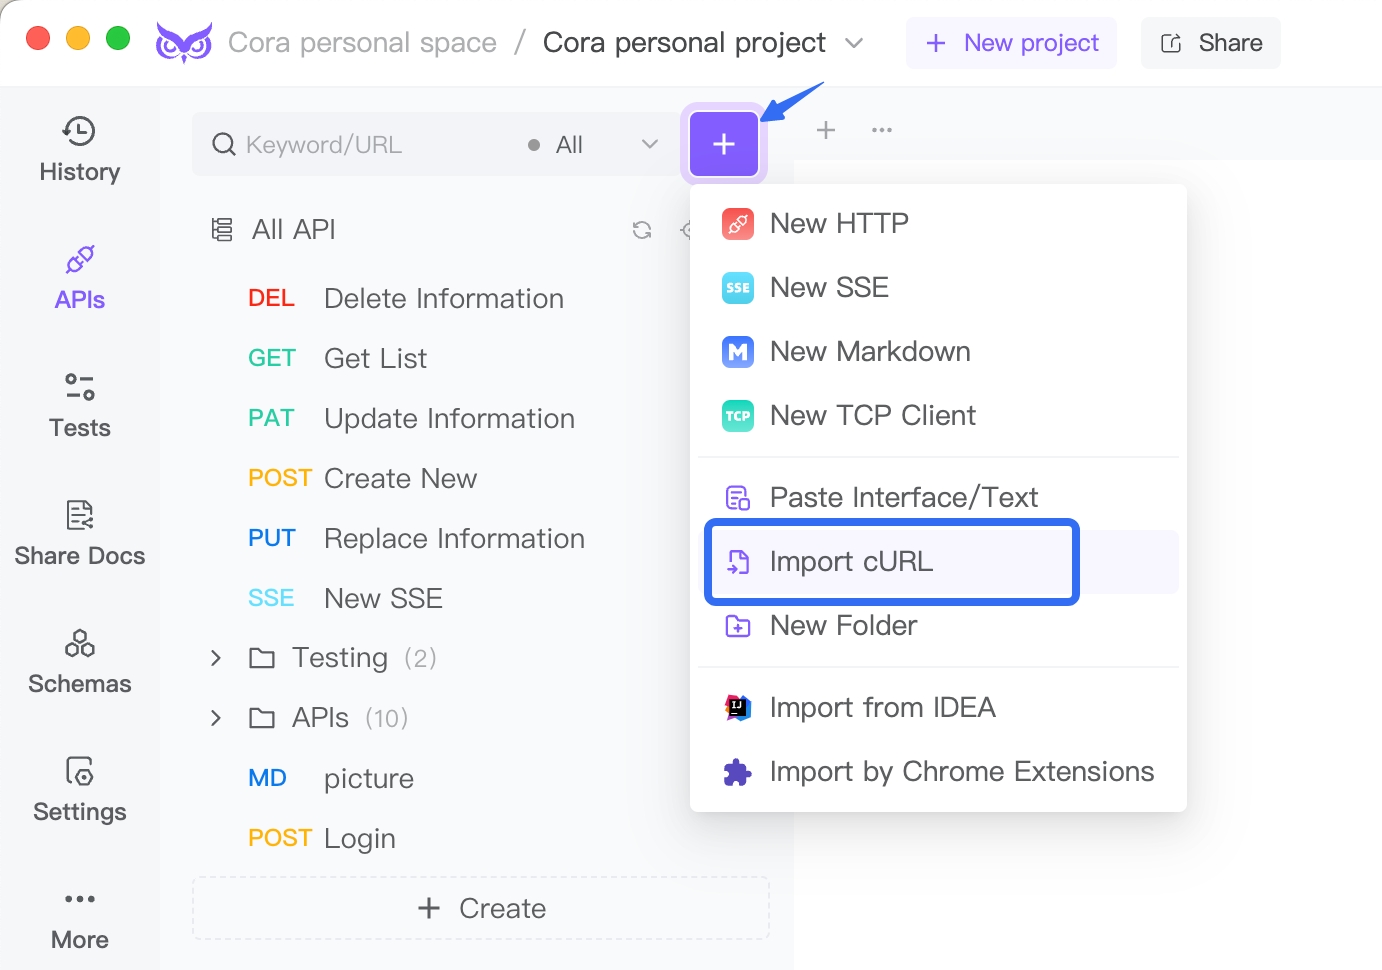
Phase 2: Configuring EchoAPI
- Import the API into EchoAPI.
- Cherry-pick the performance metrics you wish to track, such as QPS, average response times, etc.
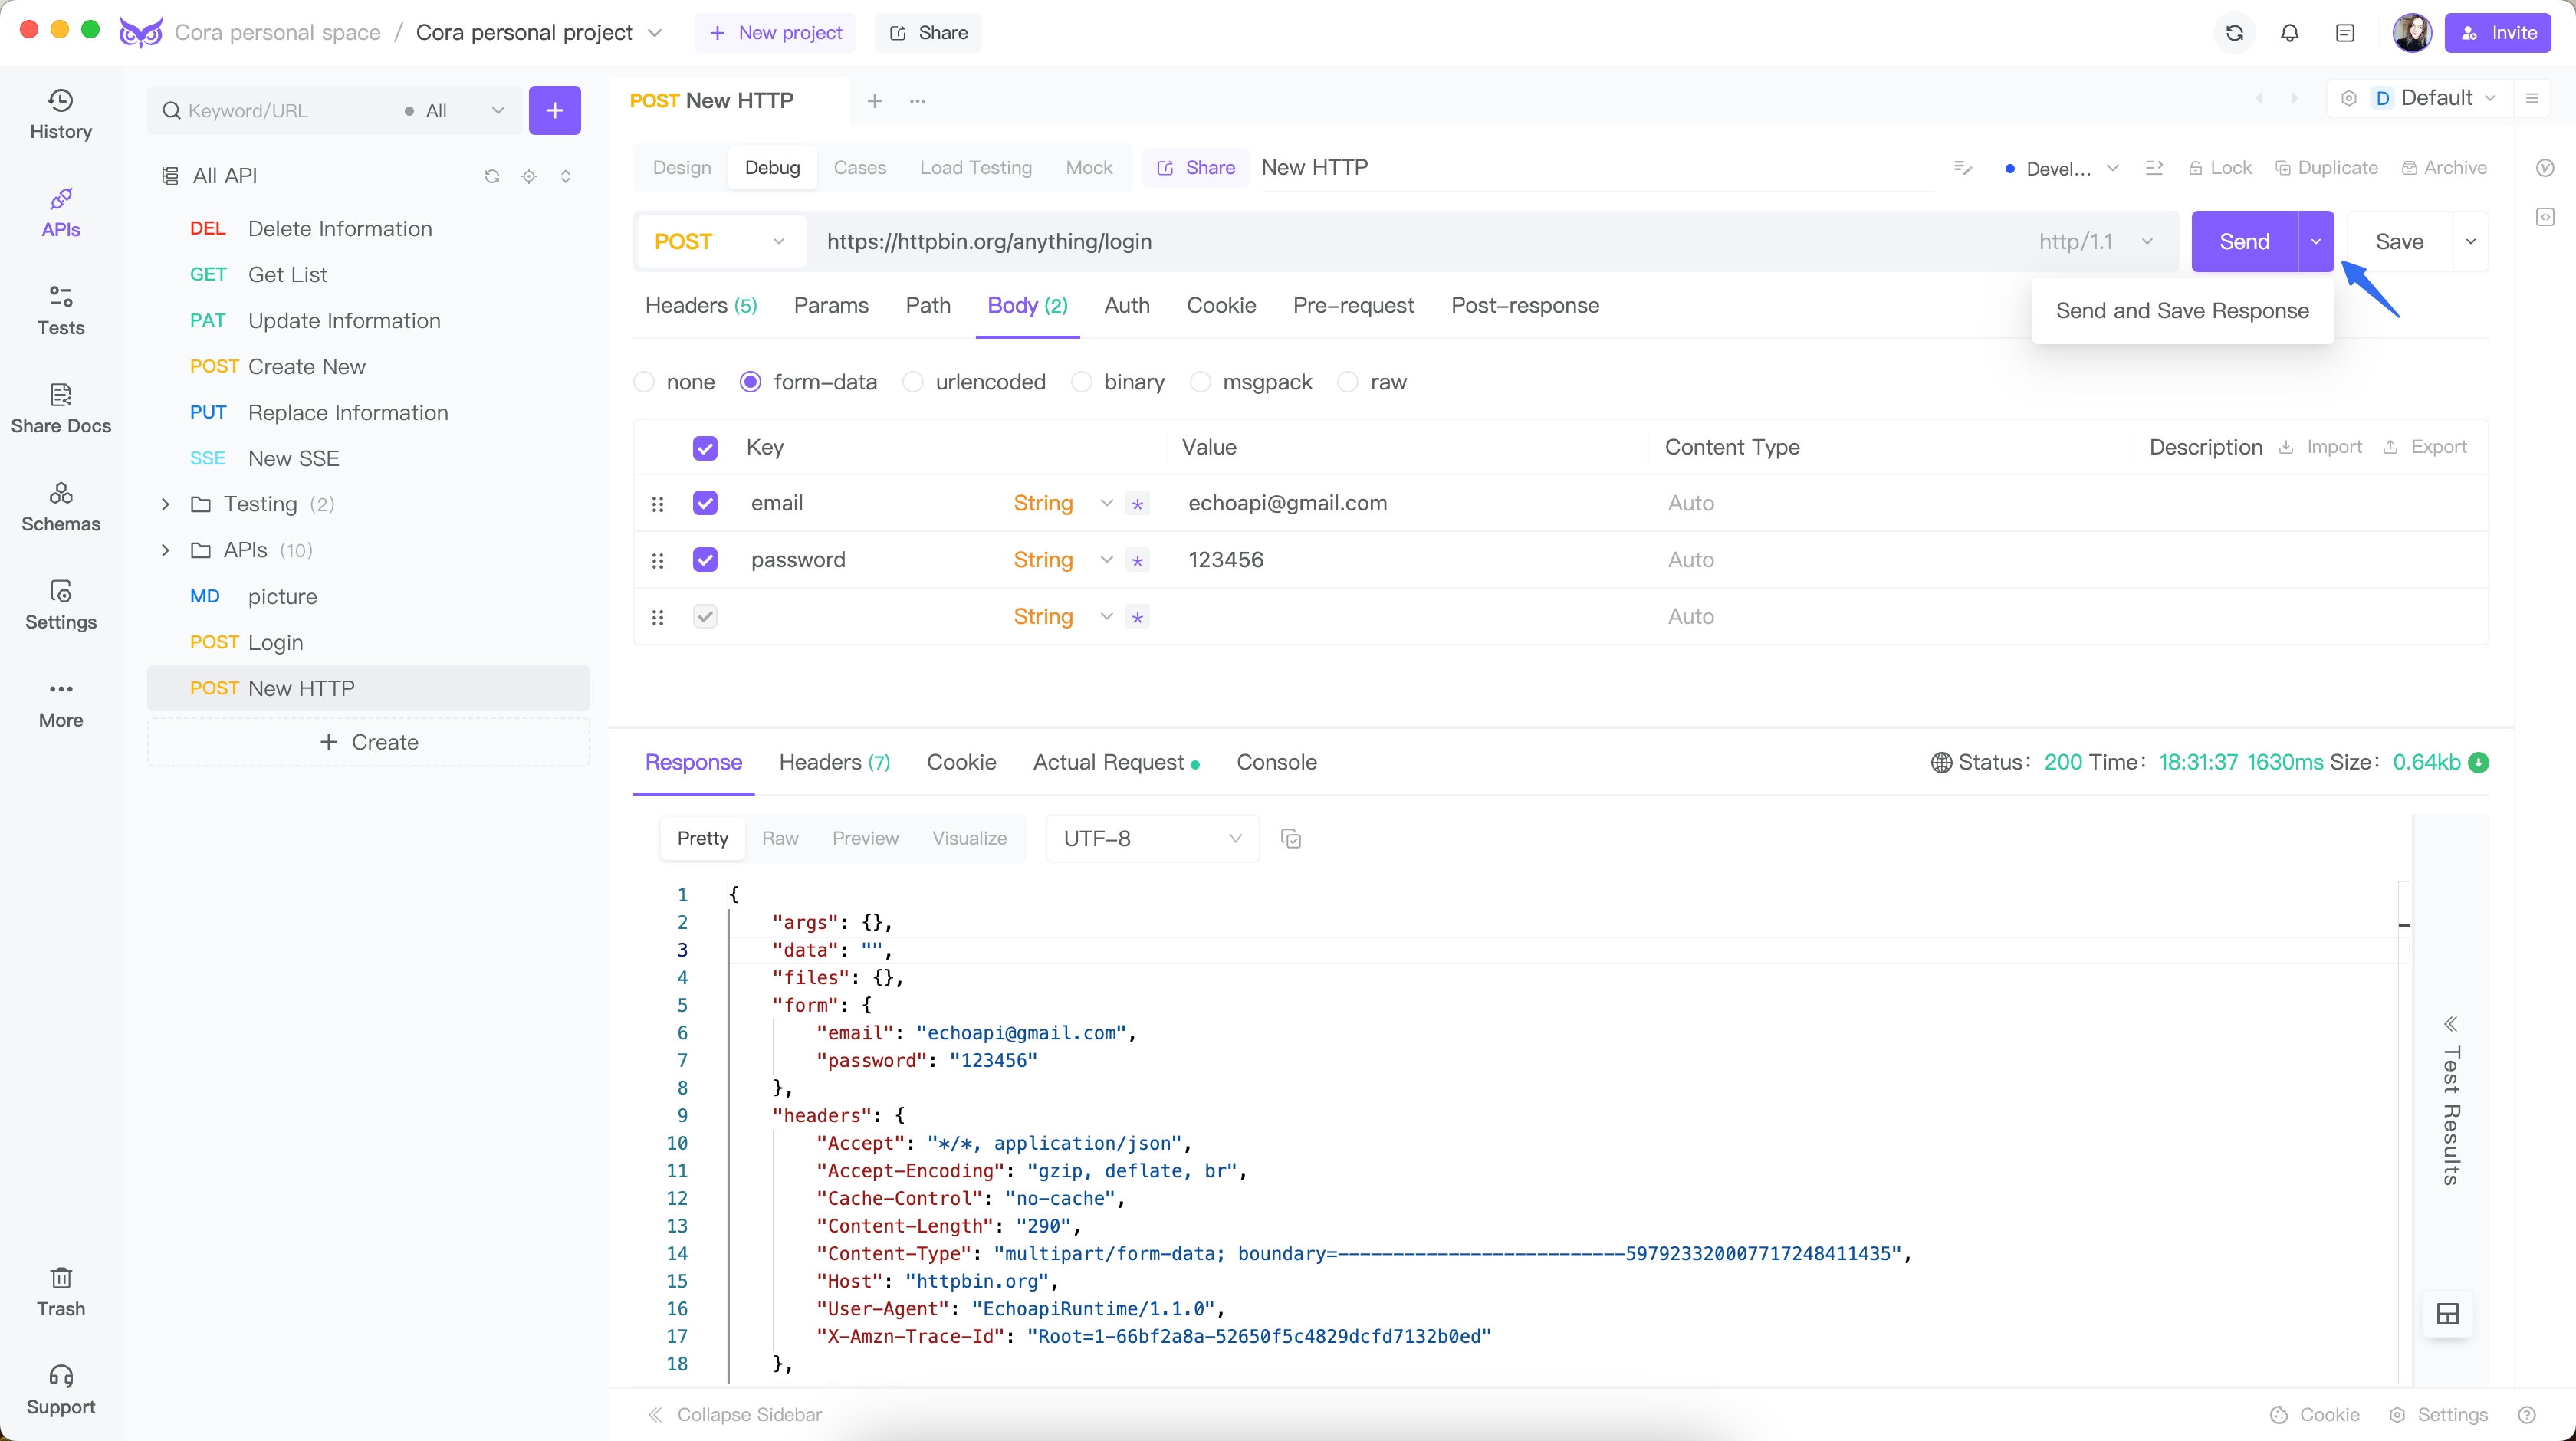
Phase 3: Saving this API
Debug this API and save it.
Phase 4: Execution of Load Testing
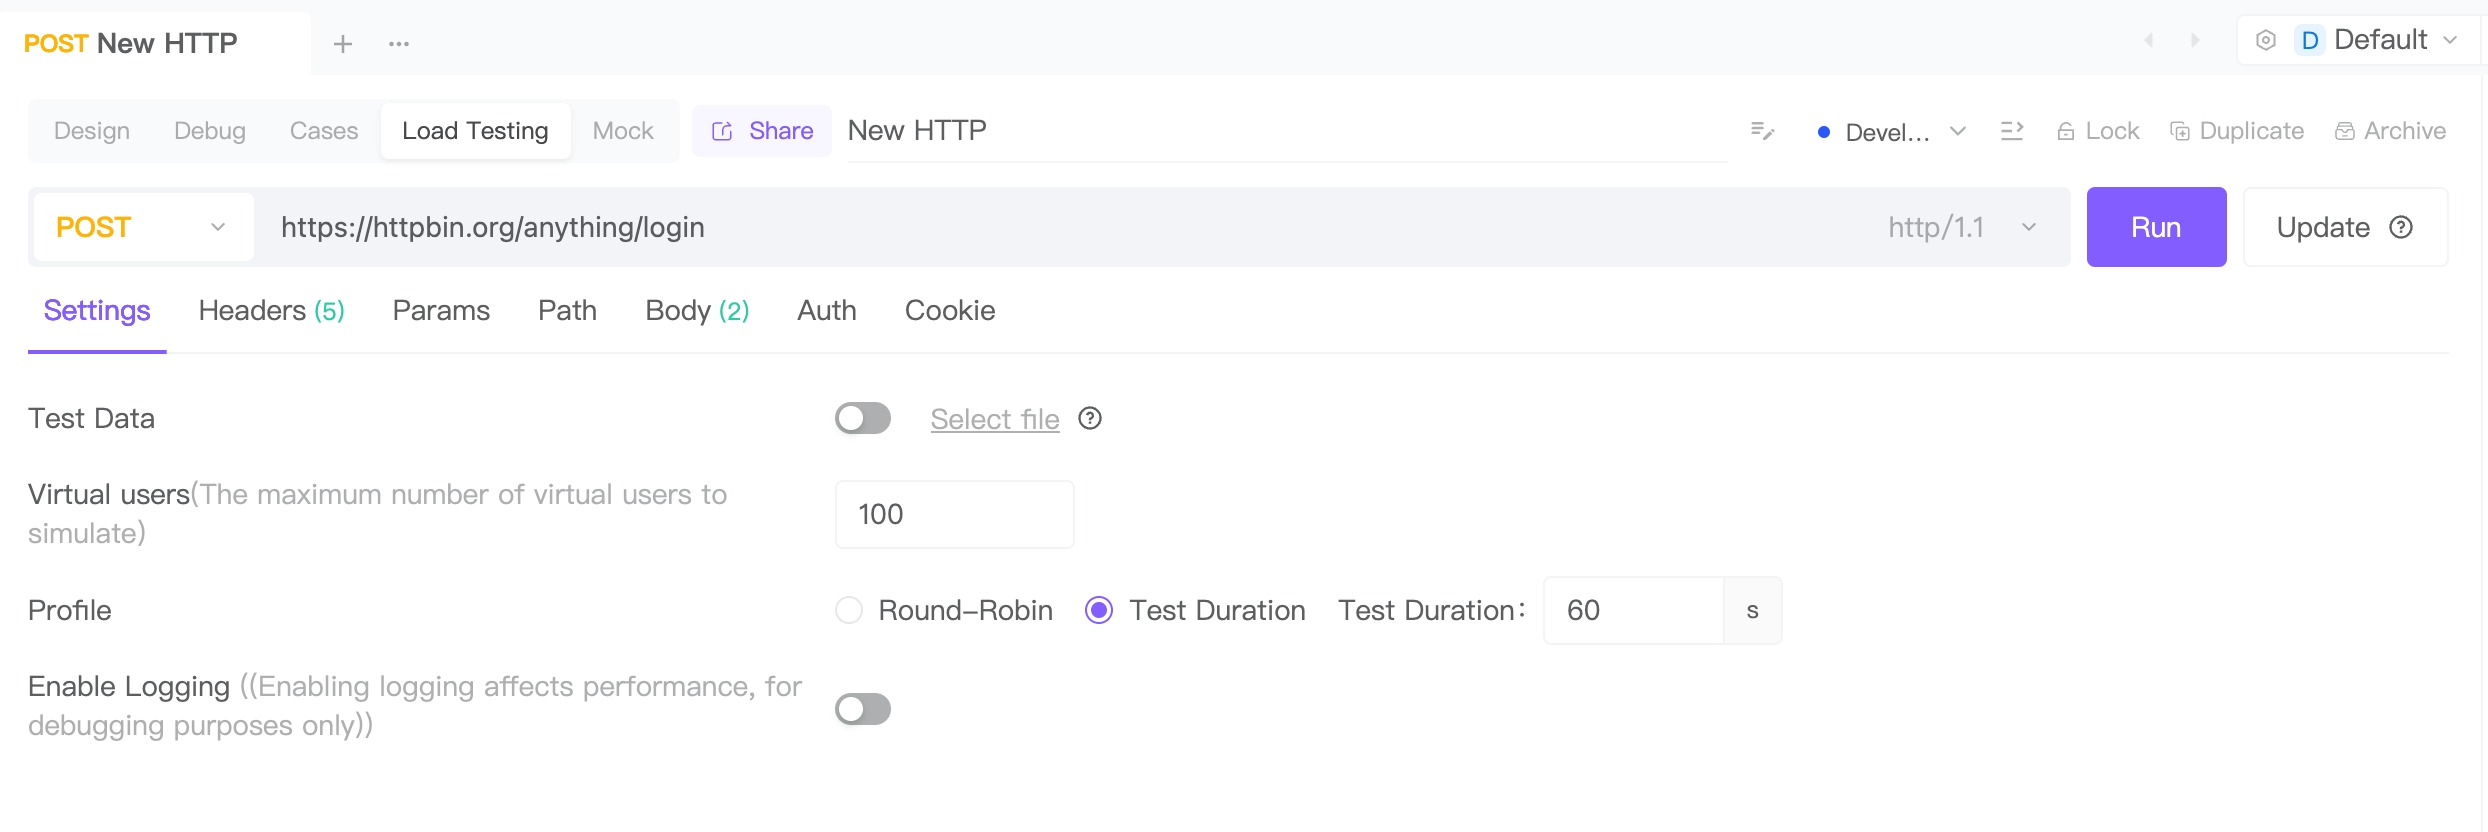
With configurations set, kick off the load testing process with a simple click.Here we set the Virtual users to 100, Test Duration to 60 seconds, and run.
Phase 5: Analyzing the Test Results
Test Report Snapshot:
- Test Date: 08/16/2024
- Test Interface: User Login API
- Testing Grounds: Httpbin Environment
Insightful Data Overview:
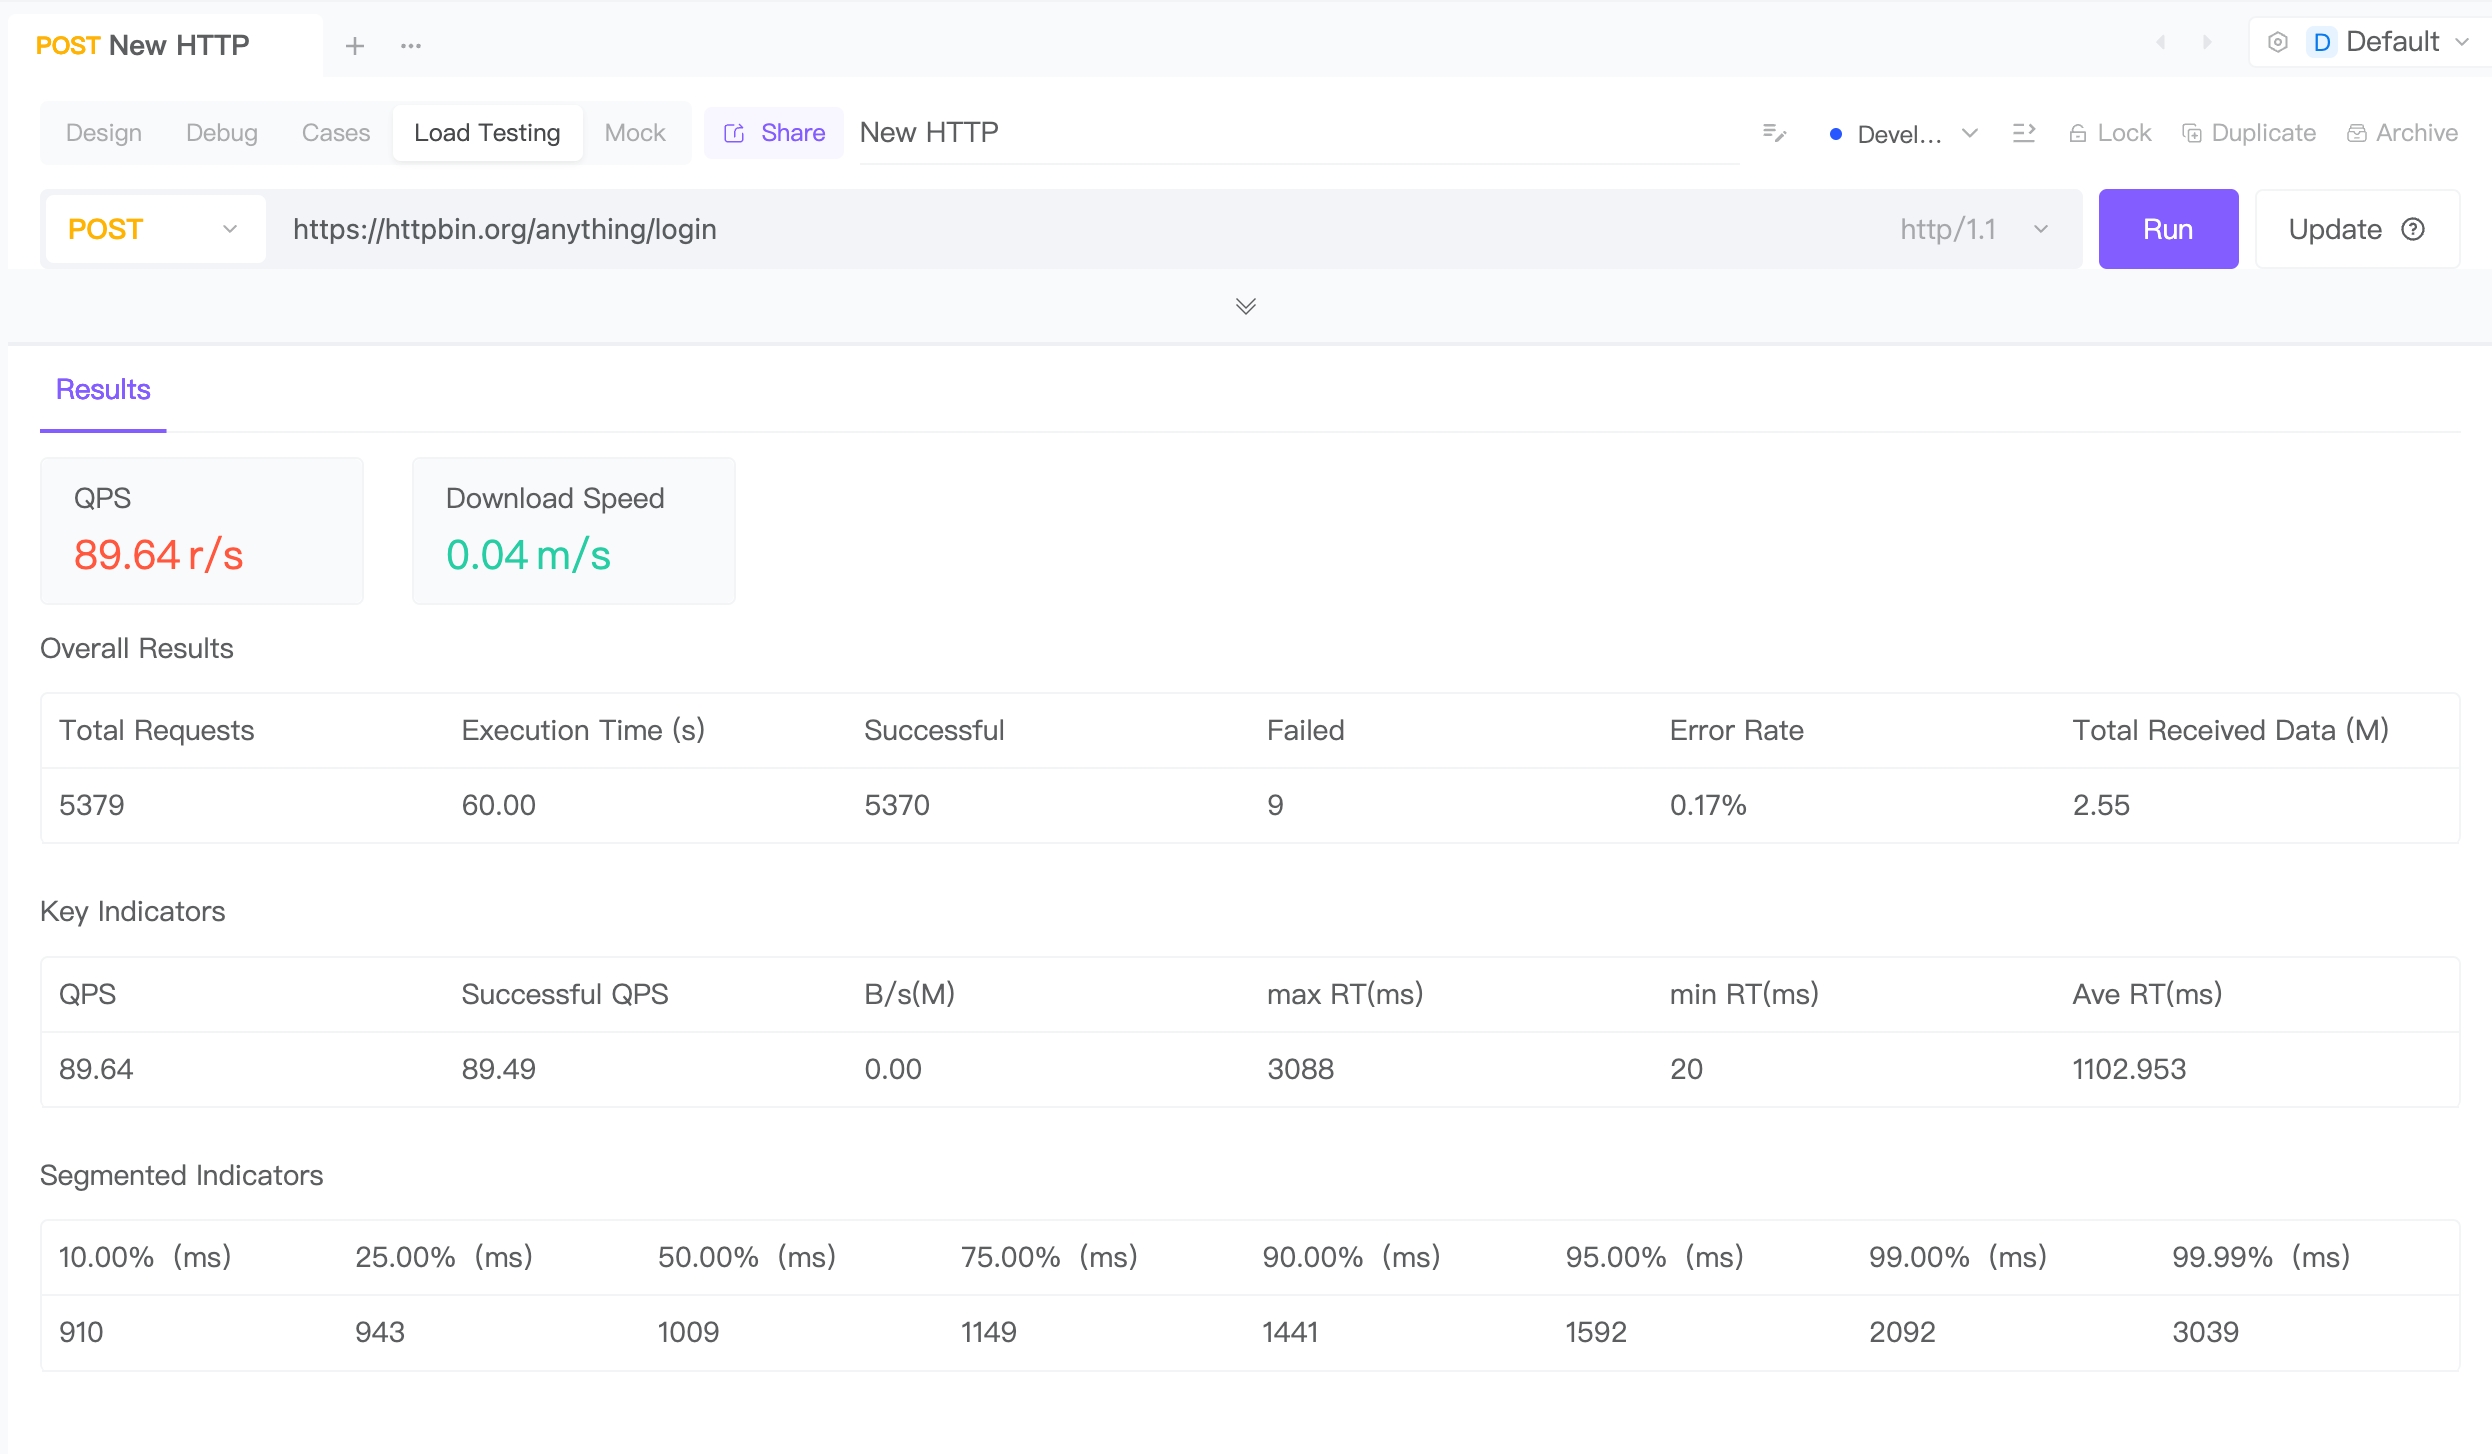
- Total Requests: 5379
- Duration of Testing: 60 seconds
- Average QPS: 89.64 requests per second
- Average Response Time: 1102.953 milliseconds
Segmented Performance Indicators:
- 0-1100ms: 50% of requests
- 1100-1500ms: 40% of requests
- 1500-2100ms: 9% of requests
- 2100ms and above: 1% of requests
Test Verdict:
Through the EchoAPI stress test, it became evident that the User Login API maintained commendably low response times even amidst high concurrency. The bulk of requests boasted response times under 1500 milliseconds, signaling robust performance. Nonetheless, a fraction (1%) of requests exceeded the 2100-millisecond mark, possibly due to resource contention during peak loads.
Phase 6: Recommendations for Optimization
Based on the test findings, here are some optimization avenues to explore:
- Streamlining Database Queries: For protracted response times, audit and optimize database queries to trim down query durations.
- Harnessing Caching: Consider caching mechanisms for frequently accessed data to bolster response speeds.
- Embracing Load Balancing: In case server resources emerge as bottlenecks, contemplate scaling up server numbers to implement load balancing.
Conclution
By leveraging EchoAPI for load testing and dissecting the ensuing test results, a panoramic view of API performance emerges. Armed with actionable insights, tailored optimization strategies can be devised to elevate user experiences and fortify system stability.


 EchoAPI for VS Code

 EchoAPI for IntelliJ IDEA

 EchoAPl-Interceptor

 EchoAPl CLI
 EchoAPI Client
 API Design
 API Debug
 API Documentation
 Mock Server


