Visualizing Responses in EchoAPI
Introduction:
Visualizing responses in EchoAPI offers a dynamic and insightful way to analyze and interpret API interactions. By leveraging this feature, users can gain a comprehensive understanding of response data, enabling them to effectively debug and optimize their API workflows. In this article, we will explore the power of visualizing responses in EchoAPI, showcasing how this tool enhances the development and testing processes for seamless API integration.

What is Response
Response in the context of API interactions refers to the data sent back from a server to a client after a request has been made. It typically includes information such as status codes, headers, and the actual content of the response, which could be in various formats like JSON, XML, or plain text.
Understanding and visualizing these responses in EchoAPI can provide valuable insights into the behavior and performance of APIs, aiding in effective troubleshooting and optimization.
The Significance of Visualizing Responses
Visualizing responses holds immense significance in API development and testing. By visually representing response data, users can easily identify patterns, anomalies, and trends within the API interactions. This visual representation enhances the comprehension of complex data structures, making it easier to pinpoint errors, optimize performance, and validate the expected outcomes of API calls. Through visualization, developers and testers can gain a deeper understanding of how data flows between client and server, leading to more efficient debugging, improved troubleshooting, and enhanced overall API functionality.
How to Use Visualization in EchoAPI
To harness the power of visualization in EchoAPI, follow these steps:
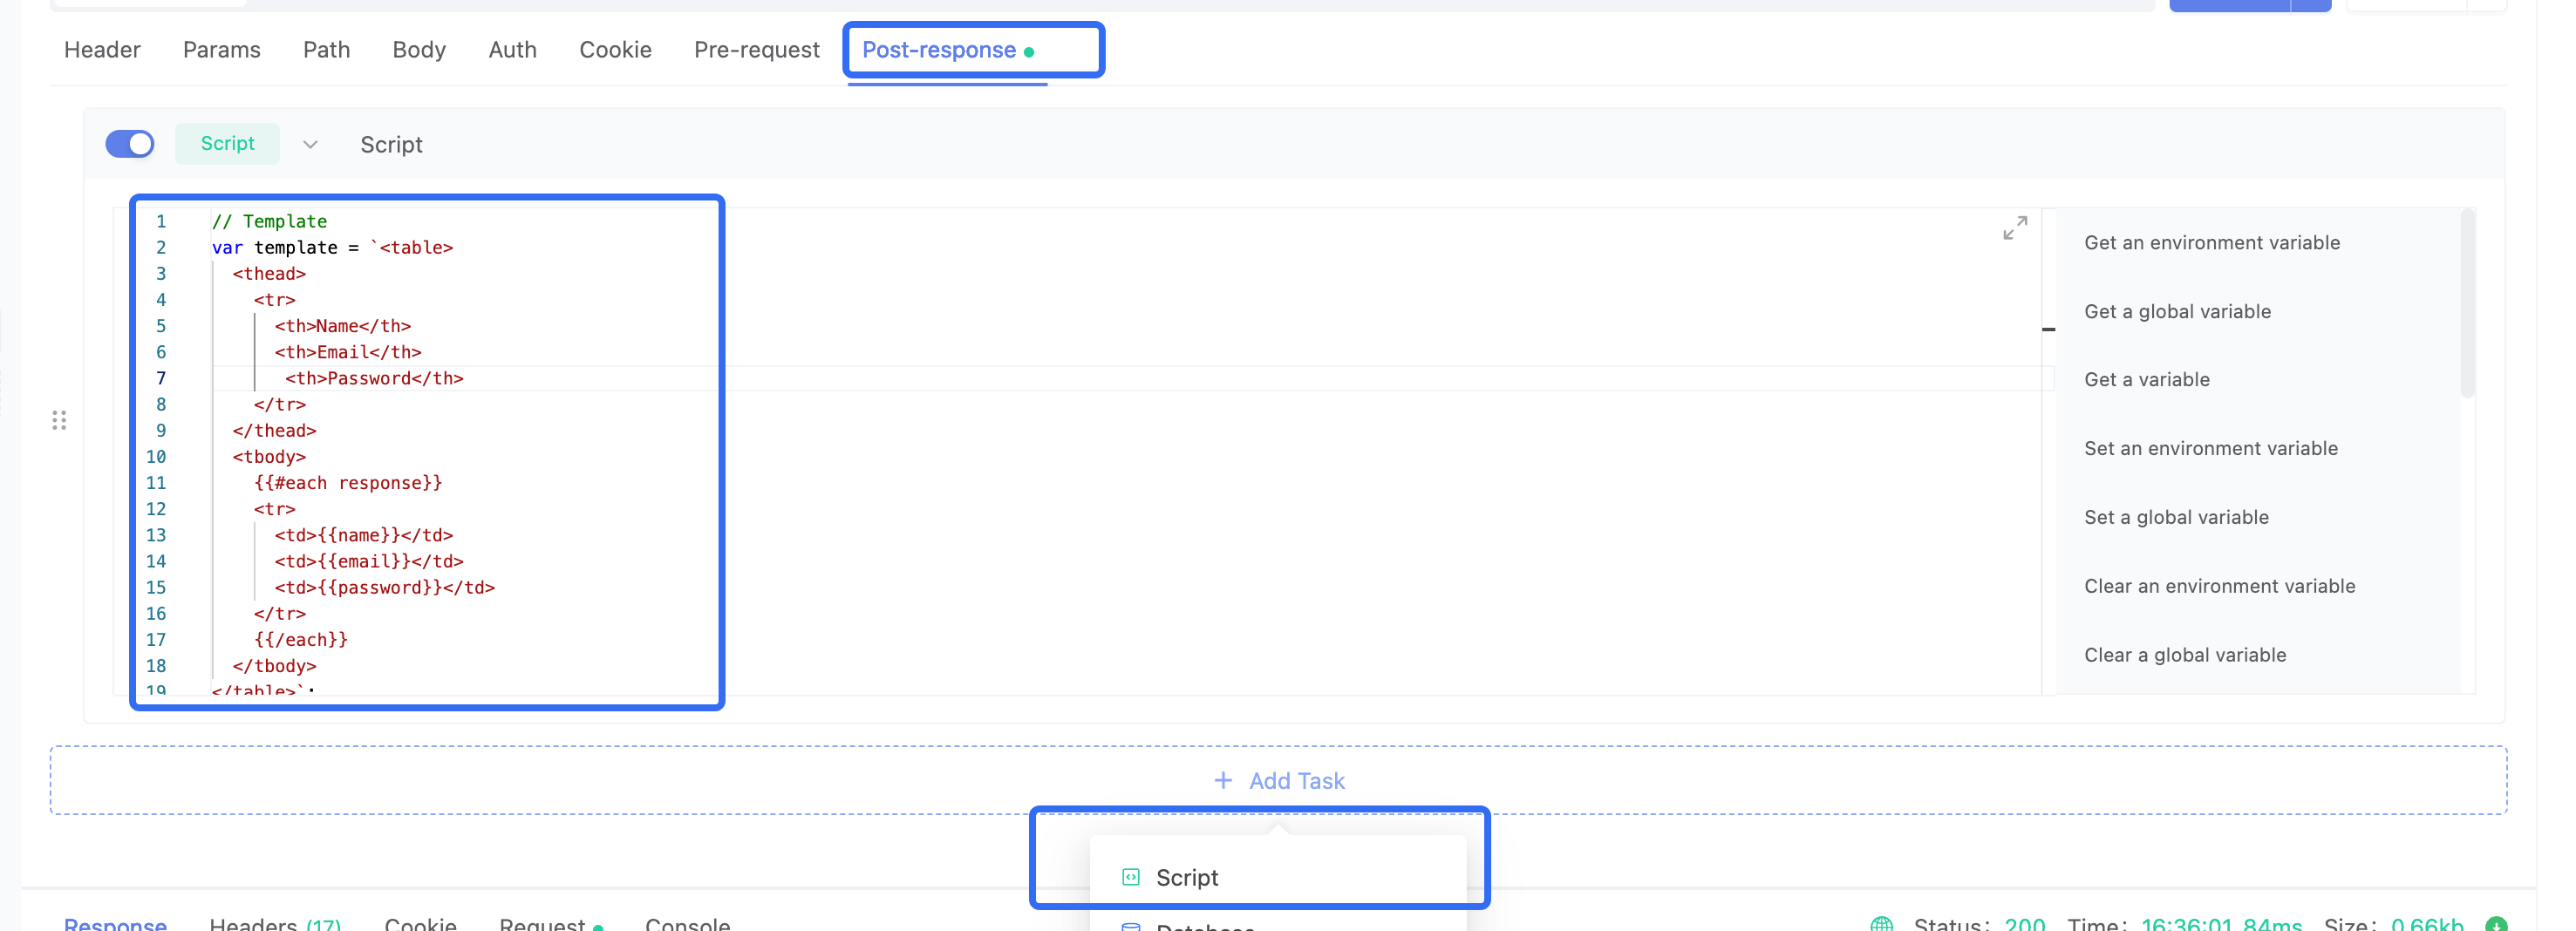
- Create a Template:
Define template strings using HTML and Handlebars syntax to specify the presentation of data. Whether it's tables, lists, cards, or any custom display format, you have the flexibility to design it as you prefer.
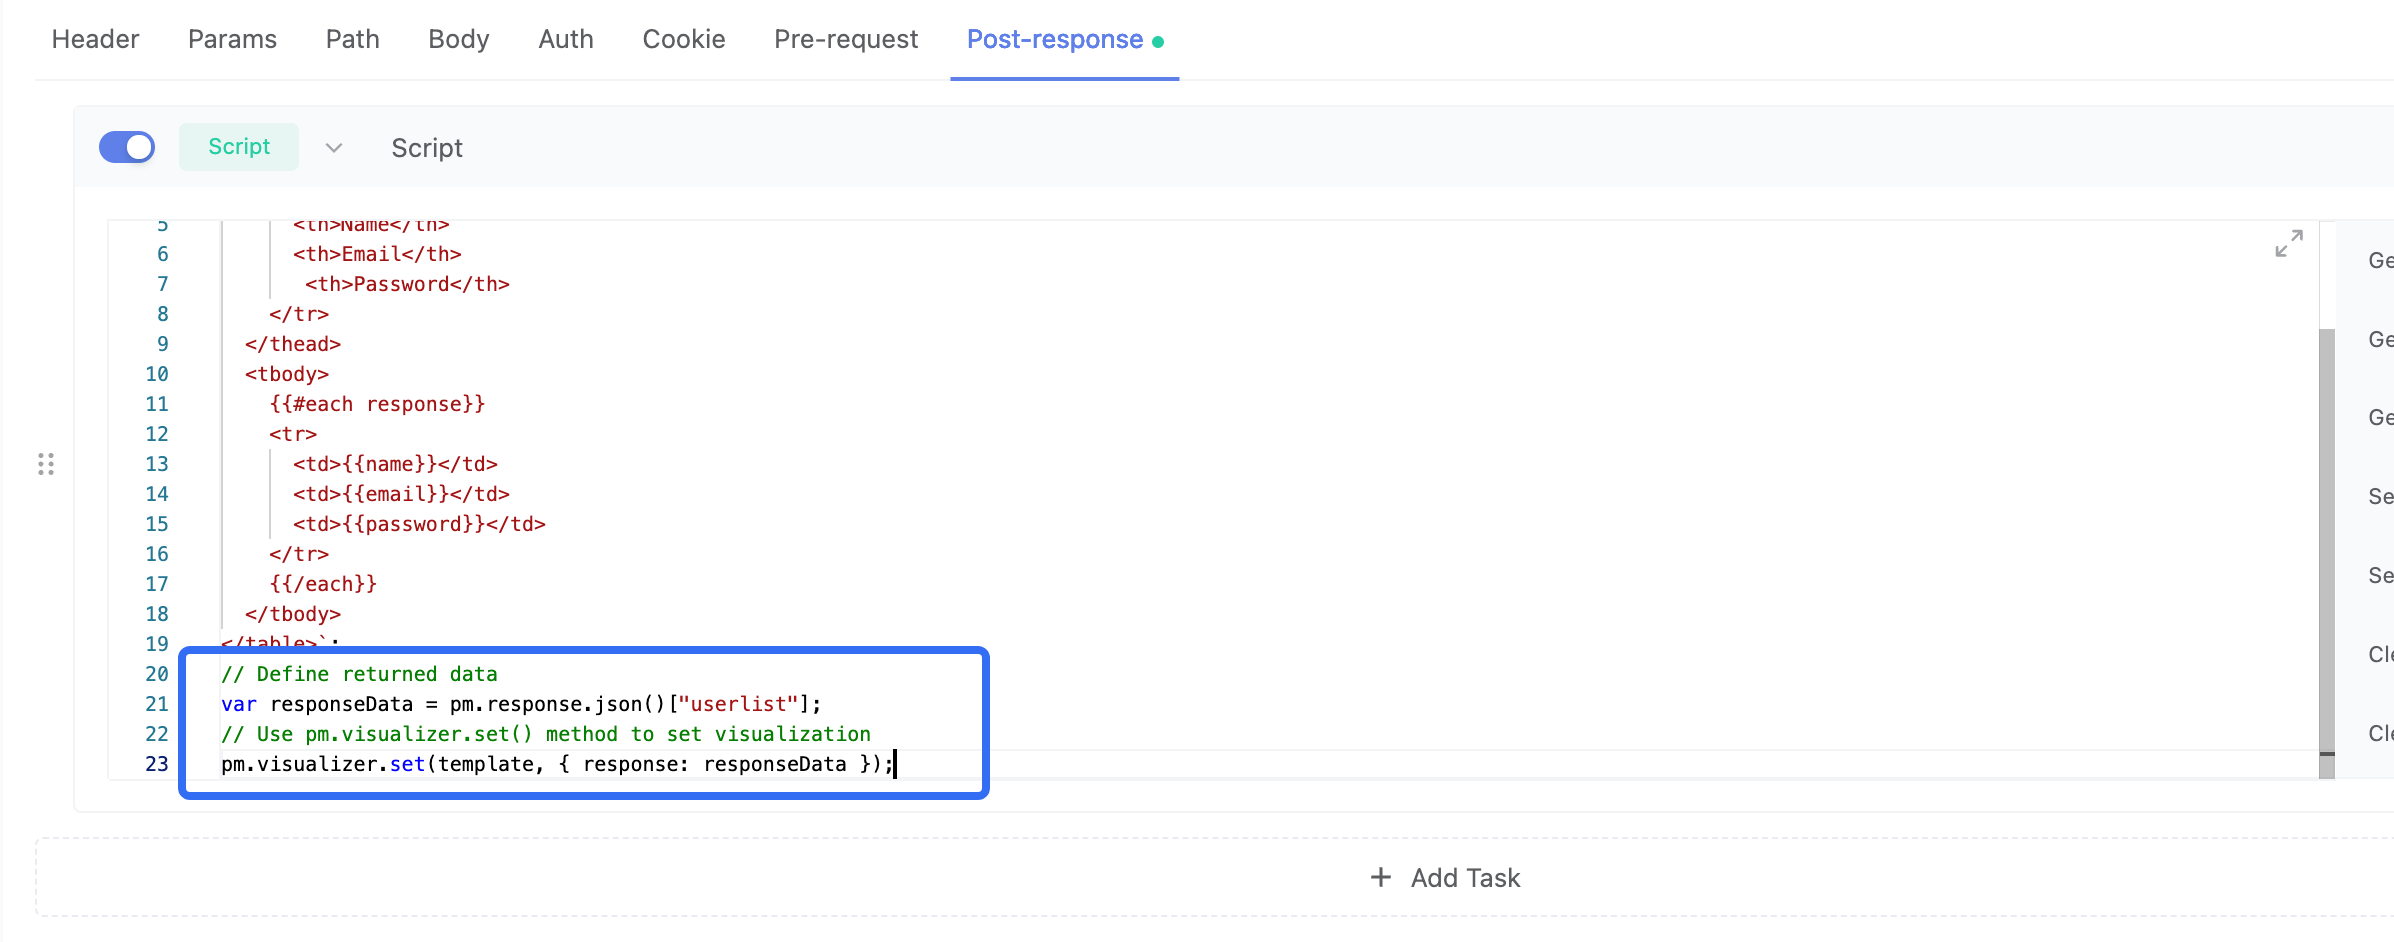
- Script Integration:
Incorporate a 'Script' in EchoAPI's 'Post-response' section. Utilize the pm.visualizer.set() method to link the template string with the response data effectively.
- Initiate Request:
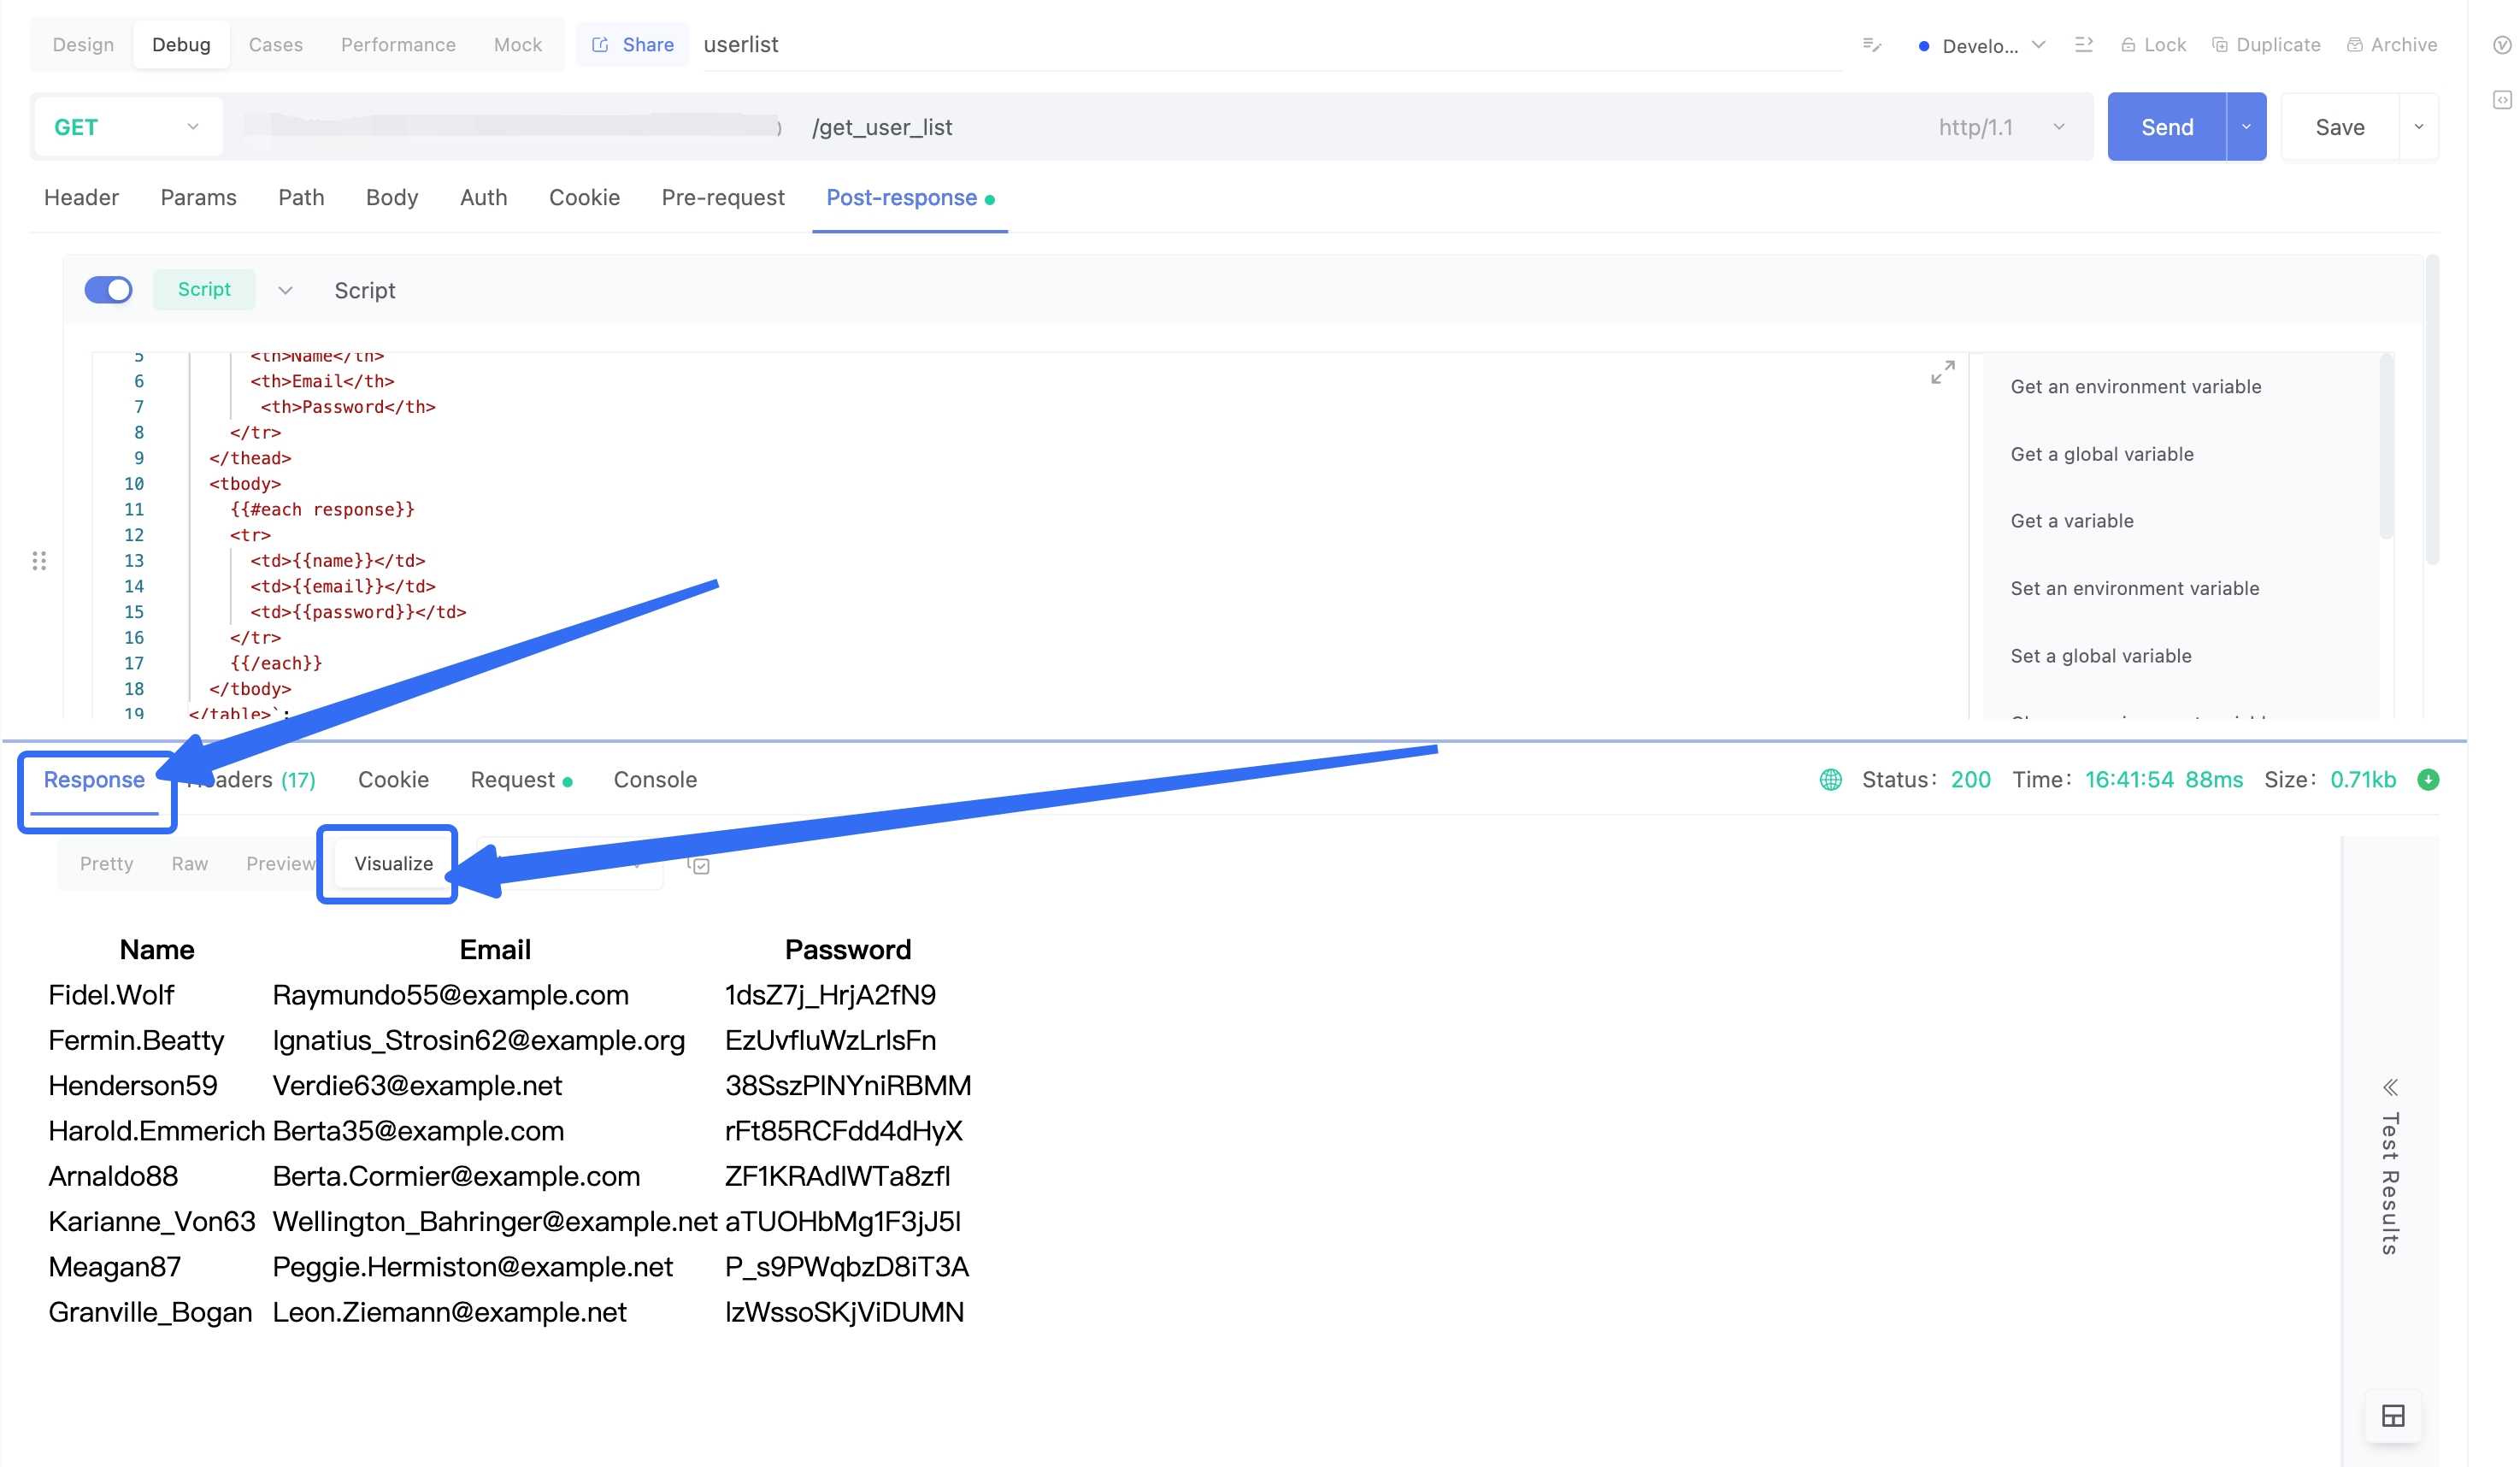
Upon sending the API request, navigate to the Visualization tab within the response to witness the visualization outcomes firsthand. This feature allows you to interpret data in a visually appealing and informative manner, facilitating a deeper understanding of API interactions.
Example
Suppose we have an API request that returns the following response:
{
    "userlist": [
        {
            "email": "Raymundo55@example.com",
            "password": "1dsZ7j_HrjA2fN9",
            "name": "Fidel.Wolf"
        },
        {
            "email": "Ignatius_Strosin62@example.org",
            "password": "EzUvfIuWzLrlsFn",
            "name": "Fermin.Beatty"
        },
        {
            "email": "Verdie63@example.net",
            "password": "38SszPINYniRBMM",
            "name": "Henderson59"
        },
        {
            "email": "Berta35@example.com",
            "password": "rFt85RCFdd4dHyX",
            "name": "Harold.Emmerich"
        },
        {
            "email": "Berta.Cormier@example.com",
            "password": "ZF1KRAdIWTa8zfI",
            "name": "Arnaldo88"
        },
        {
            "email": "Wellington_Bahringer@example.net",
            "password": "aTUOHbMg1F3jJ5I",
            "name": "Karianne_Von63"
        },
        {
            "email": "Peggie.Hermiston@example.net",
            "password": "P_s9PWqbzD8iT3A",
            "name": "Meagan87"
        },
        {
            "email": "Leon.Ziemann@example.net",
            "password": "lzWssoSKjViDUMN",
            "name": "Granville_Bogan"
        }
    ]
}
Step 1: Create Template
// Template string
var template = `<table>
  <thead>
    <tr>
      <th>Name</th>
      <th>Email</th>
      <th>Password</th>
    </tr>
  </thead>
  <tbody>
    {{#each response}}
    <tr>
      <td>{{name}}</td>
      <td>{{email}}</td>
      <td>{{password}}</td>
    </tr>
    {{/each}}
  </tbody>
</table>`;
Step 2: Write Script
// Define returned data
var responseData = pm.response.json()["userlist"];
// Use pm.visualizer.set() method to set visualization
pm.visualizer.set(template, { response: responseData });
This way of writing is also acceptable:
pm.visualizer.set(template, { response: pm.response.json()["userlist"]});
Step 3: Send Request and View Visualization Results
After sending the API request, in the "Visualize" tab of the response, you will see a table listing all users' names, emails, and passwords.
Notes
- Ensure that your template string matches the structure of the response data.
- You can add CSS styles and JavaScript scripts in the template string to achieve richer visualization effects.
- If your response data is encrypted, you can first decrypt the data in the script and then use the pm.visualizer.set() method for visualization.
Conclusion
the ability to visualize responses in EchoAPI offers a powerful tool for developers and testers to analyze and interpret API interactions effectively. By creating templates, writing scripts, and viewing the visualization results, users can gain valuable insights into the behavior of their APIs, identify issues, and optimize performance. This feature enhances the debugging process, facilitates troubleshooting, and ultimately contributes to the seamless integration of APIs into applications. Embracing visualization in EchoAPI elevates the understanding and management of API responses, leading to more efficient and robust development practices.


 EchoAPI for VS Code

 EchoAPI for IntelliJ IDEA

 EchoAPl-Interceptor

 EchoAPl CLI
 EchoAPI Client
 API Design
 API Debug
 API Documentation
 Mock Server


