What is JMeter? An In-Depth Beginner's Guide to Performance Testing
Discover JMeter, its workings, and importance in testing. Also, meet EchoAPI, a great complement to JMeter.

Exploring the World of API Testing and Performance Testing with JMeter and EchoAPI
When you're diving into the world of API and performance testing, the name JMeter frequently comes up. If you've ever wondered, "What is JMeter?" or if you’re just looking to brush up on your knowledge, you're in the right place. By the end of this post, you'll have a solid understanding of JMeter, how it works, and why it's crucial in the testing landscape. Plus, I'll introduce you to EchoAPI, a tool that can perfectly complement your JMeter experience, making your API testing journey even smoother.
Why Should You Care About API Testing?
Before we dive into JMeter, let's take a step back. Why is API testing so important? APIs are the backbone of modern applications. They connect different systems, allowing them to communicate and share data seamlessly. However, if an API fails, it can lead to significant issues, from poor performance to complete application failure. That’s where API testing comes in. By testing your APIs, you ensure they’re reliable, scalable, and perform well under various conditions. Tools like JMeter and EchoAPI are here to make this process easier.
Understanding JMeter: The Basics
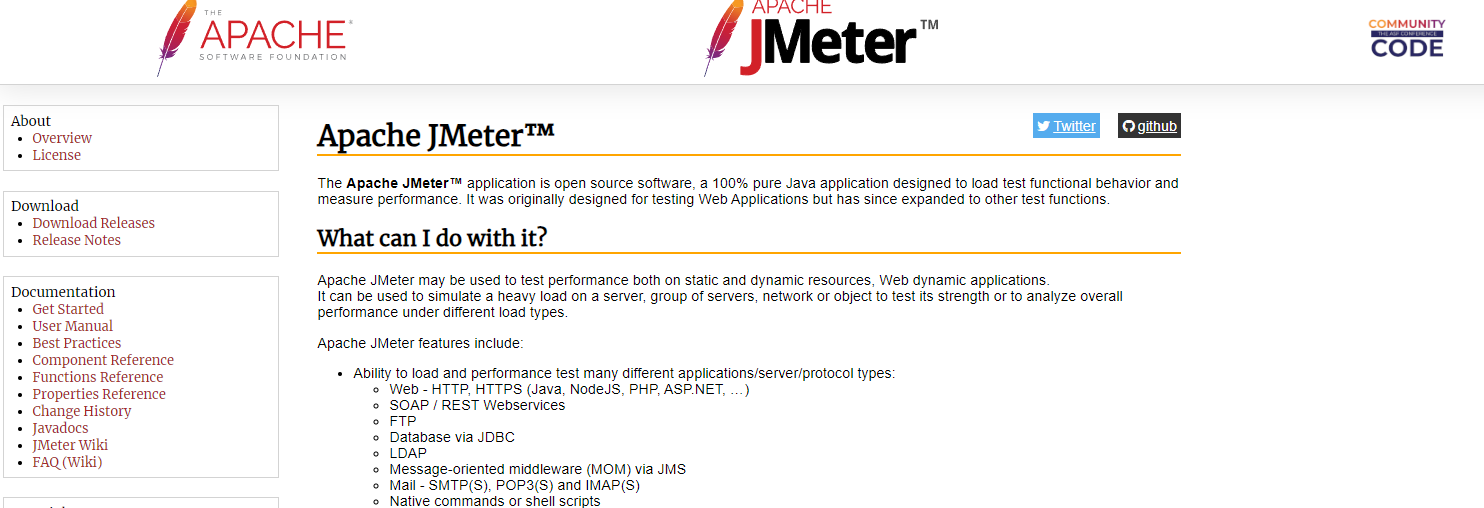
So, what exactly is JMeter? Simply put, Apache JMeter is an open-source software designed to load test and measure the performance of web applications. Originally, it was created to test web applications, but over time, its capabilities have expanded. Today, JMeter can test performance on static and dynamic resources, Web Services (SOAP/REST), databases, FTP servers, and much more.
A Quick History Lesson
JMeter was first developed by Stefano Mazzocchi of the Apache Software Foundation, who initially designed it to test the performance of Apache Tomcat, a web server. However, as the need for performance testing grew, so did JMeter’s functionality. Now, it’s one of the most widely used tools for performance testing across various industries.
How JMeter Works: An Overview
JMeter works by simulating a group of users sending requests to a target server. It then collects the responses from the server, measures response times, and logs other performance metrics. But how does it actually do this? Let’s break it down.
- Test Plans: In JMeter, everything revolves around a Test Plan. Think of it as a blueprint of your test. The Test Plan defines the series of steps JMeter will execute when you run your test. It includes the number of users, the type of requests, and any logic you want to include, like loops or conditionals.
- Thread Groups: Within your Test Plan, you’ll set up one or more Thread Groups. A Thread Group represents a group of virtual users who will execute your test steps. You can configure how many users (or threads) you want, how often they should send requests, and how long they should continue to run.
- Samplers: Samplers are the components that actually send requests to the server. JMeter supports various types of samplers, including HTTP, FTP, JDBC, and more. For API testing, you’ll most commonly use HTTP samplers.
- Listeners: Once your test is up and running, Listeners come into play. These components collect and display the results of your test, such as response times, error rates, and throughput. Listeners can present this data in various formats, including tables, graphs, and trees.

Why JMeter is Popular in Performance Testing
JMeter has become a go-to tool for performance testing for several reasons:
- Open-Source and Free: JMeter is open-source software, meaning it’s free to use and continuously updated by a community of contributors. This makes it accessible to anyone, from small startups to large enterprises.
- Versatility: As mentioned earlier, JMeter’s capabilities extend beyond just web applications. It can test APIs, databases, FTP servers, and more. This versatility makes it a valuable tool in any tester’s toolkit.
- Extensive Protocol Support: JMeter supports various protocols out of the box, including HTTP, HTTPS, SOAP, REST, FTP, and more. This broad protocol support allows testers to use JMeter in a wide range of scenarios.
- Large Community and Documentation: Given its popularity, JMeter has a large user community and extensive documentation. Whether you’re a beginner or an advanced user, you can find plenty of resources to help you solve any issues you encounter.
JMeter vs. Other Tools: How Does It Stack Up?
While JMeter is undoubtedly a powerful tool, it’s not the only one out there. Tools like EchoAPI, Postman, and LoadRunner also offer robust testing capabilities. So, how does JMeter compare?
JMeter vs. EchoAPI

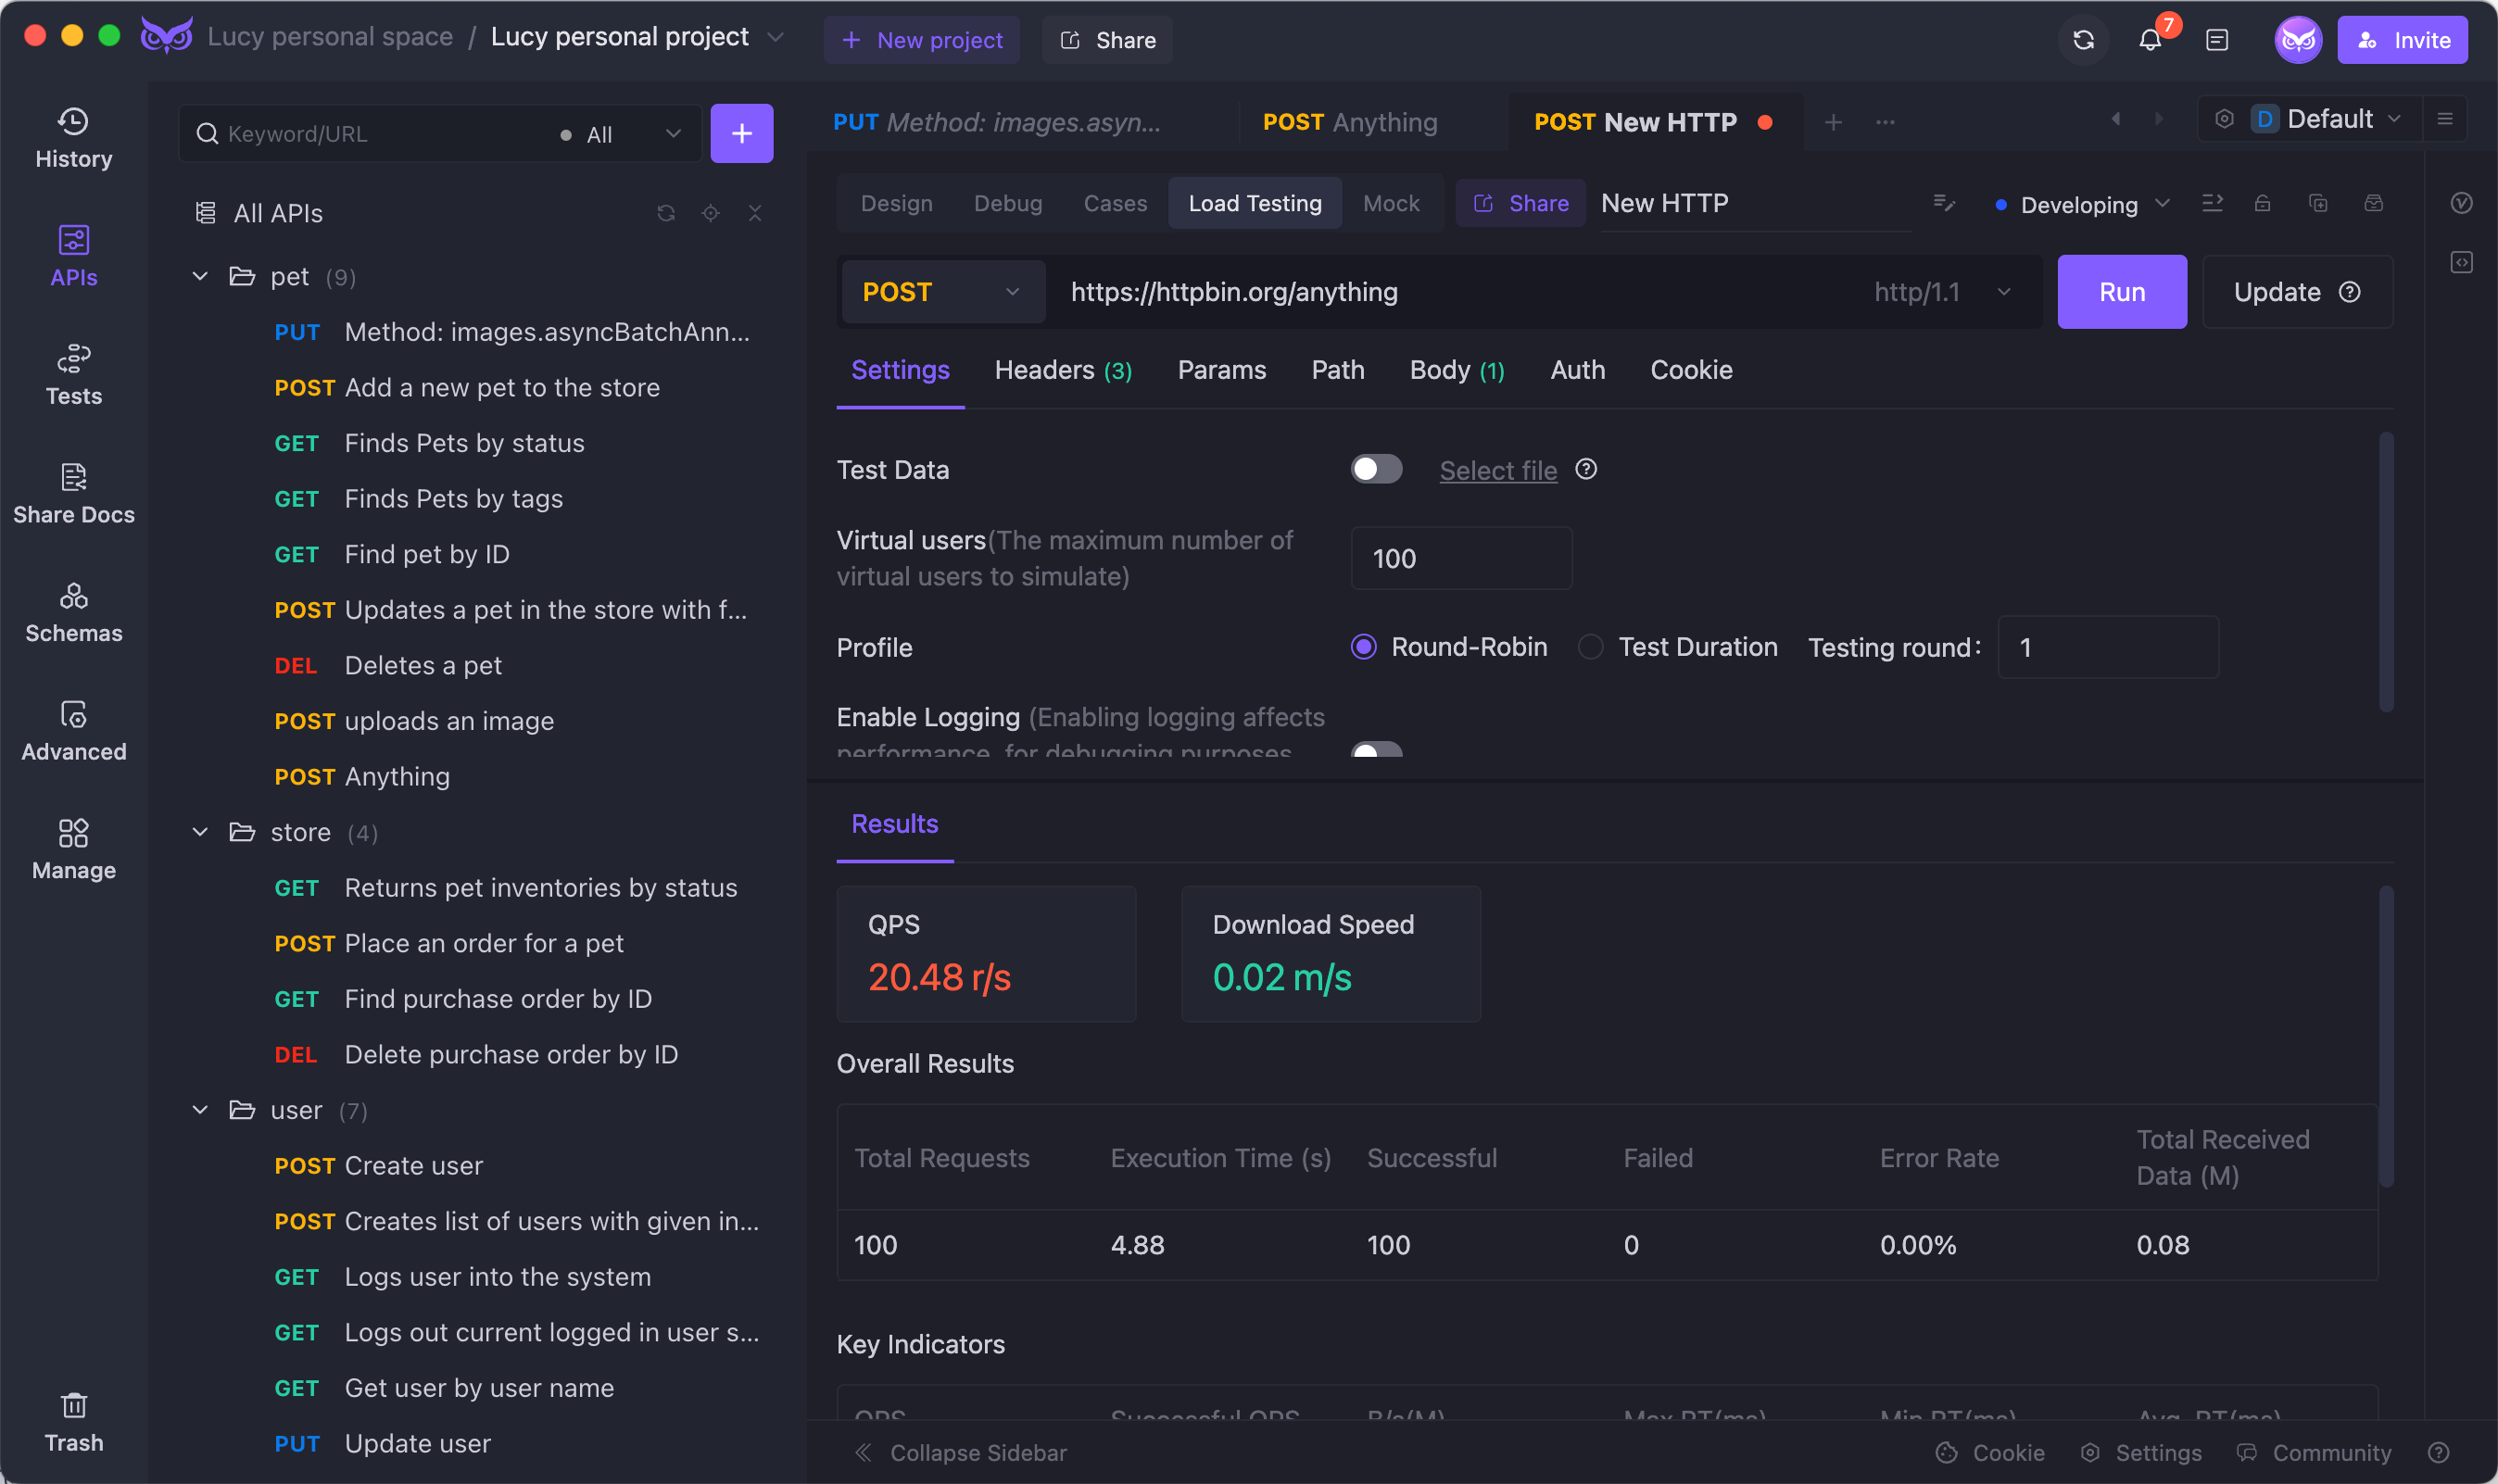
JMeter and EchoAPI serve different purposes but can complement each other well. While JMeter excels at performance testing, EchoAPI shines in API design, debugging, automated testing, and documentation. If you’re focused on API testing, EchoAPI offers a more user-friendly interface and features like:
- No Login Required: You can start using EchoAPI without the need to log in, which streamlines your workflow.
- Supports Scratch Pad: Quickly draft and test API calls without saving them permanently.
- Ultra Lightweight: Minimal resources are required, making it fast and efficient.
- 100% Compatible with Postman Script Syntax: Easily import and use your existing Postman scripts.

Download EchoAPI for free and start building, testing, and documenting your APIs with ease. While JMeter handles your performance testing, EchoAPI ensures your APIs are rock-solid from the get-go.
JMeter vs. Postman
Postman is another popular tool, primarily used for API development and testing. While Postman is user-friendly and great for functional testing, it doesn’t offer the same level of performance testing capabilities as JMeter. If your primary goal is to test API functionality, Postman is a good choice. However, for load testing and performance evaluation, JMeter is the way to go.
JMeter vs. LoadRunner
LoadRunner is a commercial performance testing tool that offers advanced features like real-time monitoring and detailed analytics. While it’s more powerful than JMeter in some aspects, it also comes with a hefty price tag. For organizations on a budget or those just starting with performance testing, JMeter provides a cost-effective alternative.
Setting Up JMeter: A Step-by-Step Guide
Ready to get started with JMeter? Here’s a step-by-step guide to setting it up and running your first test.
- Download and Install JMeter: Head over to the Apache JMeter website and download the latest version. JMeter is a Java-based application, so make sure you have the latest version of the Java Development Kit (JDK) installed on your machine.
- Launch JMeter: Navigate to the bin directory within the JMeter folder and double-click on the jmeter.bat file (for Windows) or jmeter.sh file (for Mac/Linux). This will launch the JMeter GUI.
- Create a Test Plan: In the JMeter GUI, start by creating a new Test Plan by right-clicking on the Test Plan node and selecting Add > Threads (Users) > Thread Group. Configure the Thread Group with the number of users, ramp-up period, and loop count.
- Add Samplers: Add the appropriate Samplers to your Thread Group. For example, if you’re testing an API, add an HTTP Request Sampler. Configure the sampler with the necessary details, such as the server name, path, and parameters.
- Add Listeners: Add one or more Listeners to your Test Plan to collect and display the results of your test. Popular Listeners include View Results Tree, Summary Report, and Graph Results.
- Run Your Test: Once everything is set up, run your test by clicking on the green Start button. JMeter will execute your Test Plan and display the results in the Listeners you added.
Best Practices for Using JMeter
To get the most out of JMeter, it’s essential to follow some best practices:
- Use Realistic Test Data: Always use realistic data in your tests to ensure that your test results accurately reflect the conditions your application will face in production.
- Start Small and Scale Up: When setting up your tests, start with a small number of users and gradually increase the load to identify bottlenecks.
- Monitor System Resources: Monitor the CPU, memory, and network usage of both your test machine and the server you’re testing to understand your application’s performance under different conditions.
- Analyze and Interpret Results: Take the time to analyze the results and interpret what they mean for your application. Look for patterns, anomalies, and areas for improvement.
Integrating JMeter with Other Tools
JMeter is powerful on its own, but it can be even more effective when integrated with other tools.
Continuous Integration with Jenkins
Integrate JMeter with Jenkins to automate your performance tests and run them as part of your CI/CD pipeline.
API Testing with EchoAPI
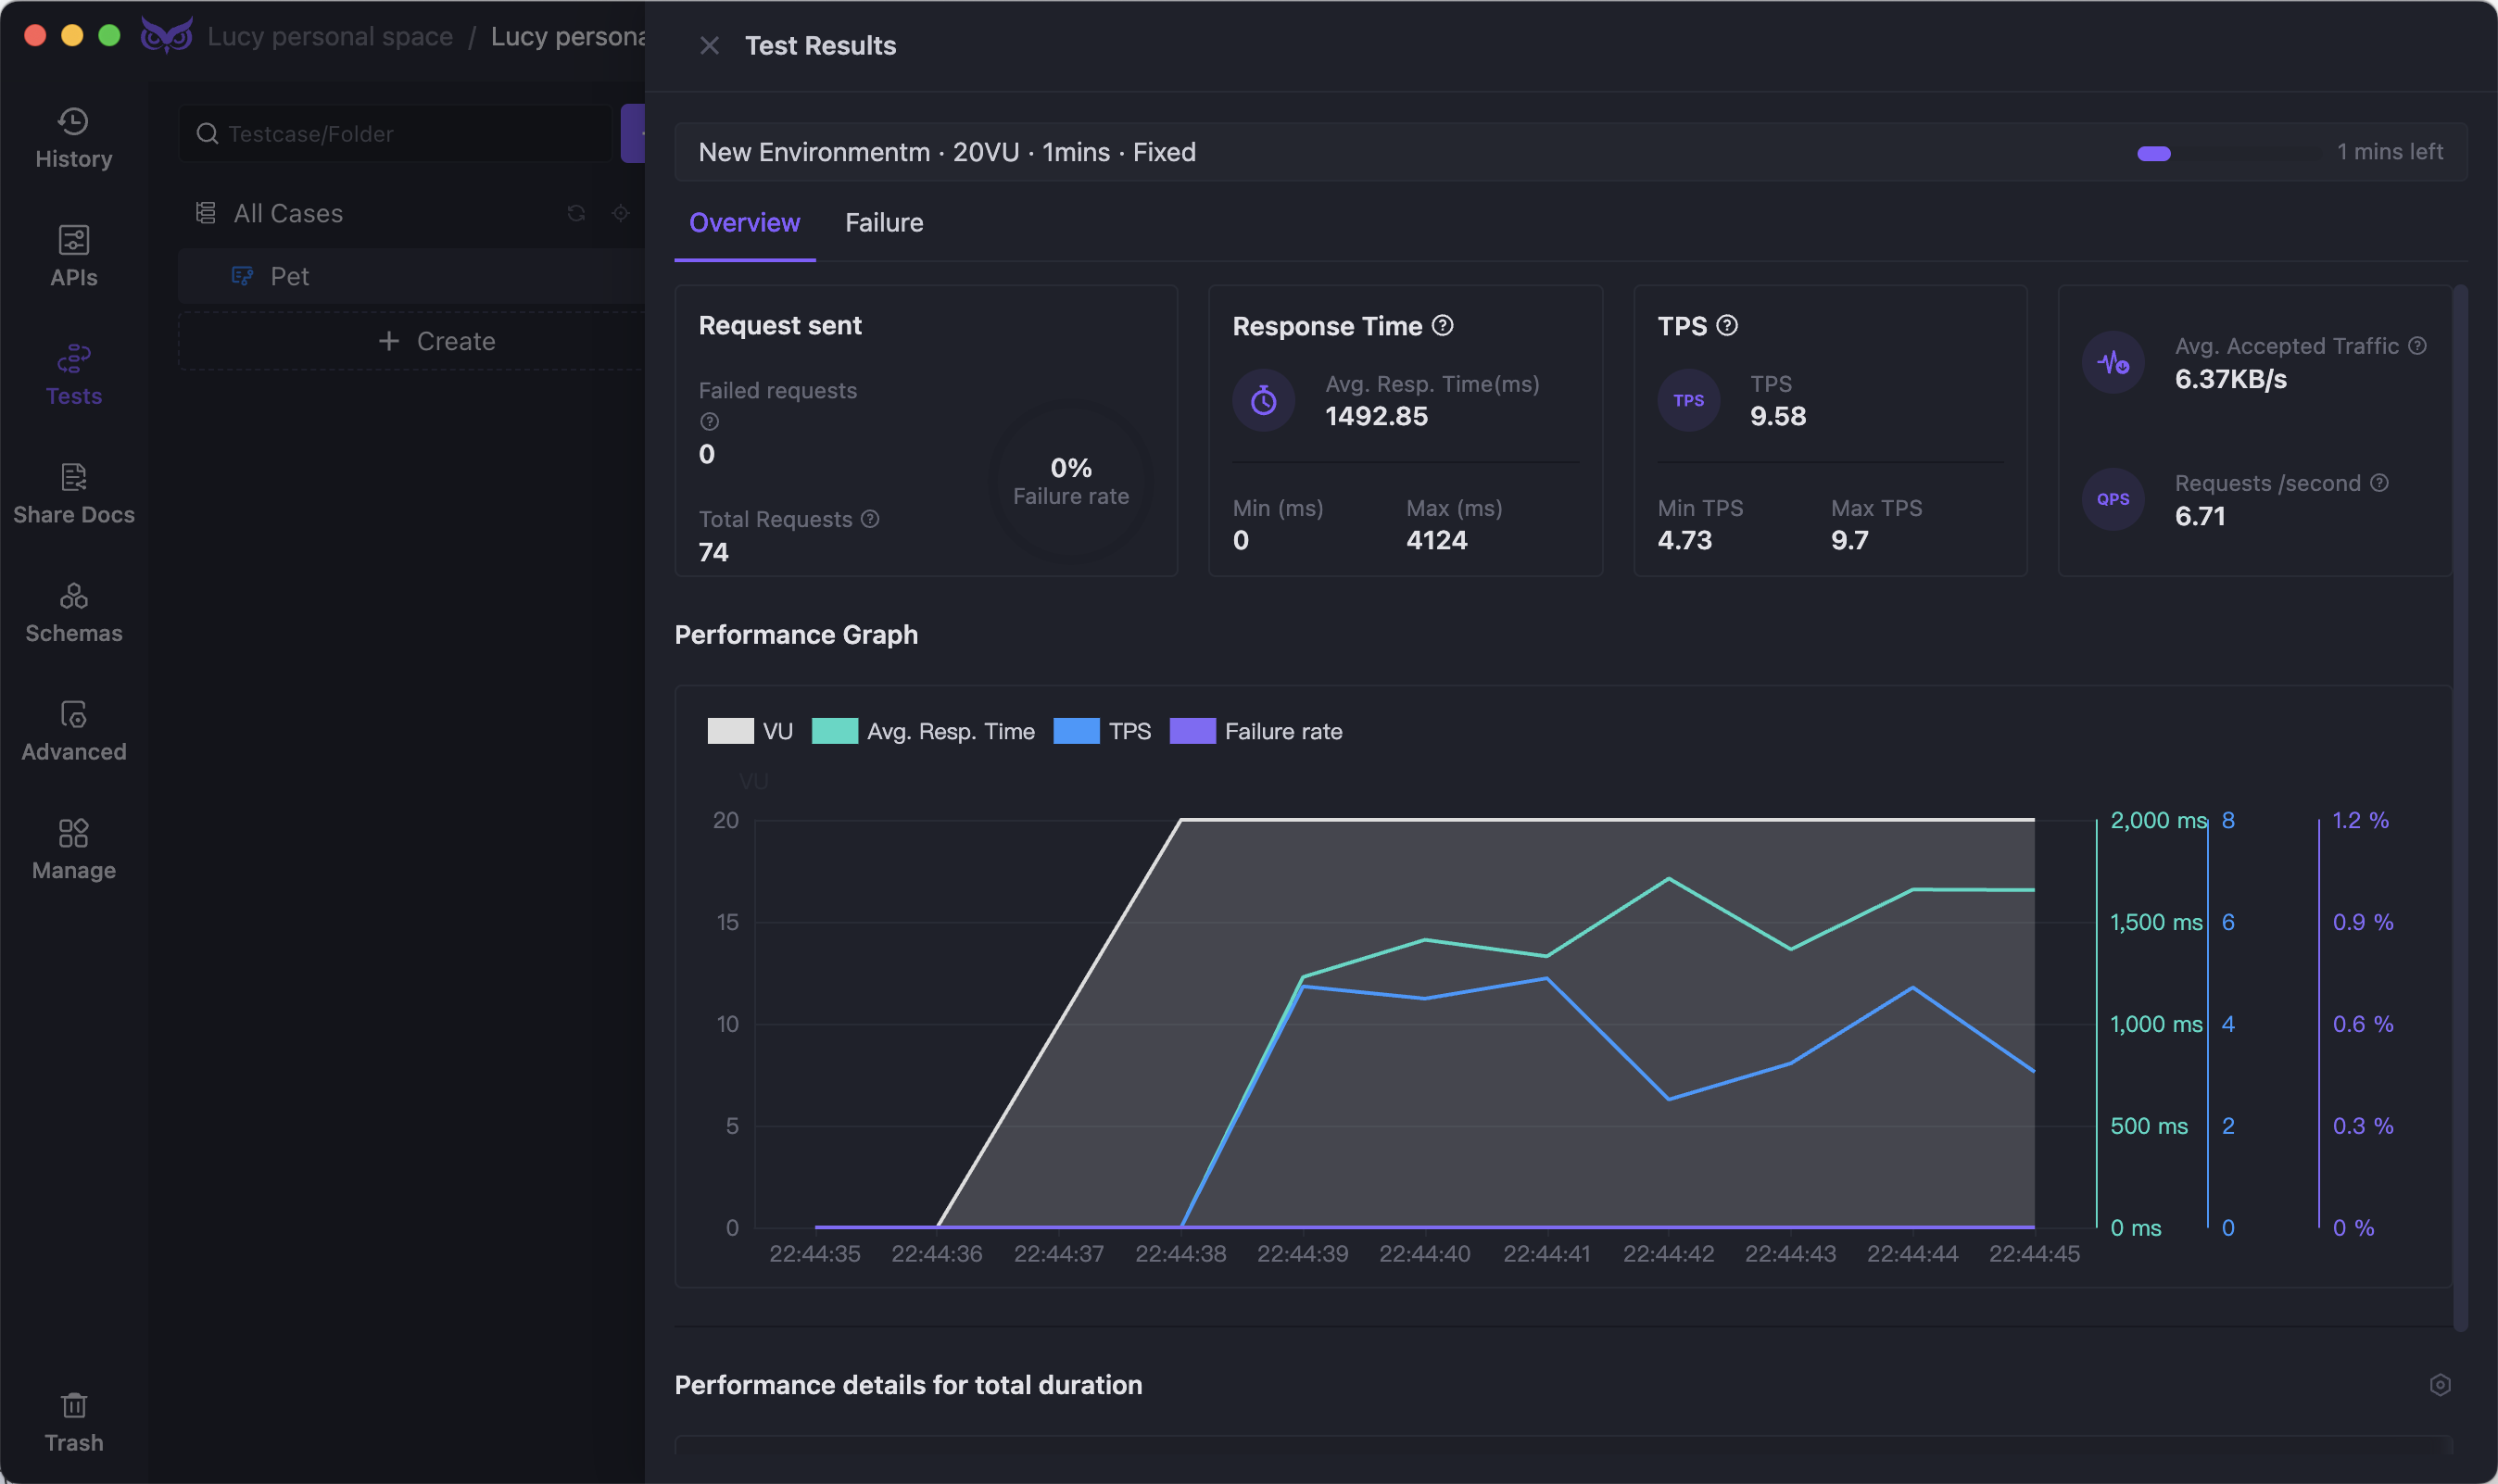
As mentioned earlier, EchoAPI is an excellent tool for API testing and documentation. Use EchoAPI to create and manage your API tests, ensuring your APIs are both functional and performant while JMeter handles the performance testing.
Load Testing with BlazeMeter
BlazeMeter is a cloud-based load testing platform that integrates seamlessly with JMeter, allowing you to run large-scale tests from multiple locations and providing detailed analytics and reporting.
Challenges and Limitations of JMeter
While JMeter is a fantastic tool, it’s not without its challenges and limitations:
- Steep Learning Curve: For beginners, JMeter can be a bit daunting. The interface is not as intuitive as some other tools, and setting up complex tests requires a good understanding of the tool.
- Resource Intensive: JMeter can be resource-intensive, especially when running large tests. It's essential to have a powerful machine if you're planning to simulate thousands of users.
- Limited Real-Time Reporting: While JMeter provides various listeners for reporting, it doesn’t offer real-time reporting capabilities. You'll need to wait until the test is complete to analyze the results.
JMeter in Action: A Real-World Example
Case Study: E-Commerce Website Load Testing
Imagine you're working for an e-commerce company that's about to launch a new product line. You expect a massive influx of traffic and want to ensure your website can handle the load.
Challenge: The website needs to support thousands of concurrent users without crashing or slowing down. You need to test the performance of various pages, including the home page, product pages, and checkout process.
Solution: Using JMeter, you set up a series of test plans that simulate thousands of users browsing the site, adding items to their cart, and completing purchases. You configure JMeter to run these tests over an extended period, gradually increasing the number of users.
Outcome: The test results reveal that the website can handle up to 10,000 concurrent users before performance starts to degrade. Armed with this information, your team makes the necessary optimizations to ensure a smooth launch.
Final Thoughts: Is JMeter Right for You?
JMeter is a powerful and versatile tool that plays a crucial role in performance testing. Whether you're testing APIs, web applications, or other types of systems, JMeter provides the tools you need to ensure your application can handle real-world usage demands. While it has its challenges, the benefits far outweigh the drawbacks, making it an essential tool for any tester's toolkit.
However, JMeter is just one piece of the puzzle. Tools like EchoAPI can complement your testing strategy by providing robust API testing and documentation capabilities. Together, they create a comprehensive testing solution that ensures your applications are both functional and performant.


 EchoAPI for VS Code

 EchoAPI for IntelliJ IDEA

 EchoAPl-Interceptor

 EchoAPl CLI
 EchoAPI Client
 API Design
 API Debug
 API Documentation
 Mock Server


